Bootcamp 2015: Optimizacija konverzije in prihodkov
- 1. Andraž Štalec OPTIMIZACIJA KONVERZIJE IN PRIHODKOV
- 3. Dreaming about Growth hacking
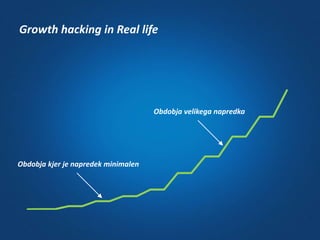
- 4. Growth hacking in Real life Obdobja kjer je napredek minimalen Obdobja velikega napredka
- 5. How to do it? MEASURE ANALYZE OPTIMIZE DELIVER RESULTS
- 6. CONDUCT A BUSINESS OVERVIEW
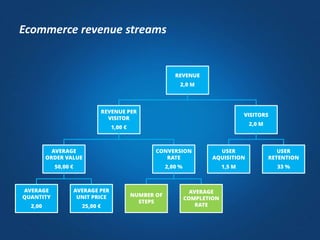
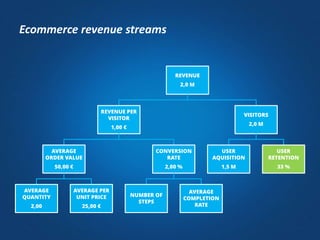
- 7. REVENUE 2,0 M REVENUE PER VISITOR 1,00 € AVERAGE ORDER VALUE 50,00 € AVERAGE QUANTITY 2,00 AVERAGE PER UNIT PRICE 25,00 € CONVERSION RATE 2,00 % NUMBER OF STEPS AVERAGE COMPLETION RATE VISITORS 2,0 M USER AQUISITION 1,5 M USER RETENTION 33 % Ecommerce revenue streams
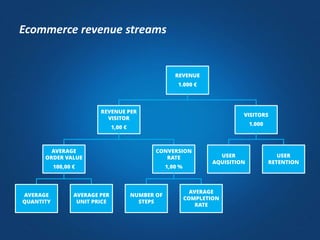
- 8. REVENUE 1.000 € REVENUE PER VISITOR 1,00 € AVERAGE ORDER VALUE 100,00 € AVERAGE QUANTITY AVERAGE PER UNIT PRICE CONVERSION RATE 1,00 % NUMBER OF STEPS AVERAGE COMPLETION RATE VISITORS 1.000 USER AQUISITION USER RETENTION Ecommerce revenue streams
- 9. MINIMAL SUCCESS VOLUME ~ 10.000 VISITORS
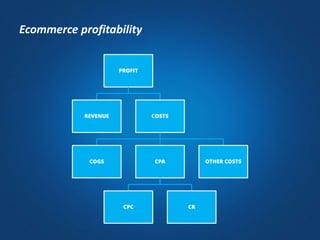
- 10. PROFIT REVENUE COSTS COGS CPA CPC CR OTHER COSTS Ecommerce profitability
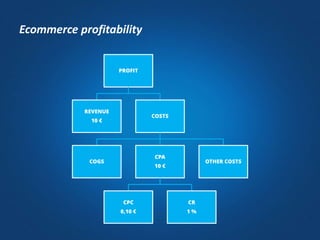
- 11. PROFIT REVENUE 10 € COSTS COGS CPA 10 € CPC 0,10 € CR 1 % OTHER COSTS Ecommerce profitability
- 12. FIND WEAK POINTS
- 13. REVENUE 2,0 M REVENUE PER VISITOR 1,00 € AVERAGE ORDER VALUE 50,00 € AVERAGE QUANTITY 2,00 AVERAGE PER UNIT PRICE 25,00 € CONVERSION RATE 2,00 % NUMBER OF STEPS AVERAGE COMPLETION RATE VISITORS 2,0 M USER AQUISITION 1,5 M USER RETENTION 33 % Ecommerce revenue streams
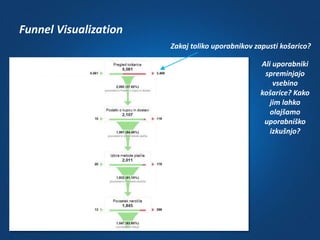
- 14. Funnel Visualization Zakaj toliko uporabnikov zapusti košarico? Ali uporabniki spreminjajo vsebino košarice? Kako jim lahko olajšamo uporabniško izkušnjo?
- 15. Where should you spend your efforts?
- 16. Goal Flow 21 % uporabnikov se iz podatkov o dostavi vrne na pregled košarice. Kaj je vzrok? 18 % uporabnikov se iz povzetka naročila vrne na izbiro metode plačila. Kaj je vzrok?
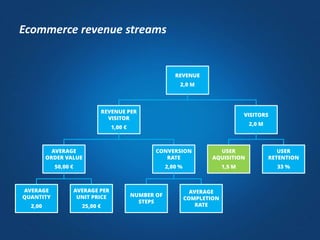
- 17. REVENUE 2,0 M REVENUE PER VISITOR 1,00 € AVERAGE ORDER VALUE 50,00 € AVERAGE QUANTITY 2,00 AVERAGE PER UNIT PRICE 25,00 € CONVERSION RATE 2,00 % NUMBER OF STEPS AVERAGE COMPLETION RATE VISITORS 2,0 M USER AQUISITION 1,5 M USER RETENTION 33 % Ecommerce revenue streams
- 18. Aquisition Overview Kako je porazdeljen obisk med kanale? Google AdWords ima najvišji CR in najnižji BR
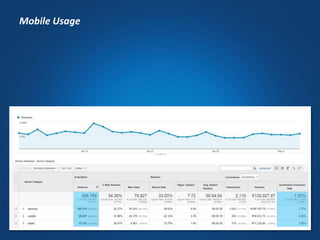
- 19. Mobile Usage
- 20. REVENUE 2,0 M REVENUE PER VISITOR 1,00 € AVERAGE ORDER VALUE 50,00 € AVERAGE QUANTITY 2,00 AVERAGE PER UNIT PRICE 25,00 € CONVERSION RATE 2,00 % NUMBER OF STEPS AVERAGE COMPLETION RATE VISITORS 2,0 M USER AQUISITION 1,5 M USER RETENTION 33 % Ecommerce revenue streams
- 21. Shopping Behavior Analysis Zakaj si 72 % uporabnikov nikoli ne ogleda izdelka? Segmentacija po napravi, tipu uporabnika itd.
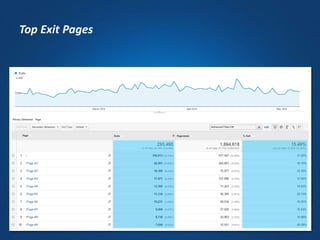
- 23. Top Exit Pages
- 24. Behaviour Flow Najbolj obiskana spletna stran ima visok Exit rate
- 25. In-Page Analytics Podpovprečen CTR Fold-line za 95 % uporabnikov
- 26. Site Search
- 27. REVENUE 2,0 M REVENUE PER VISITOR 1,00 € AVERAGE ORDER VALUE 50,00 € AVERAGE QUANTITY 2,00 AVERAGE PER UNIT PRICE 25,00 € CONVERSION RATE 2,00 % NUMBER OF STEPS AVERAGE COMPLETION RATE VISITORS 2,0 M USER AQUISITION 1,5 M USER RETENTION 33 % Ecommerce revenue streams
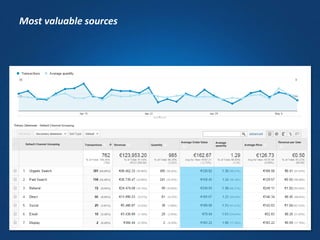
- 29. Most valuable user category
- 30. Optimize for all stages of CDJ PERSUASIONAL LANDING PAGES TRANSACTIONAL CONVERSION PAGES INTERIOR PAGESINFORMATIONAL DO THINK SEE
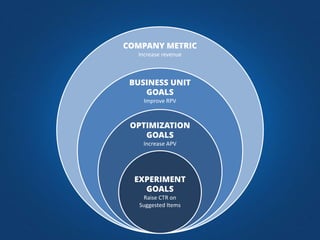
- 32. EXPERIMENT GOALS Raise CTR on Suggested Items OPTIMIZATION GOALS Increase APV BUSINESS UNIT GOALS Improve RPV COMPANY METRIC Increase revenue
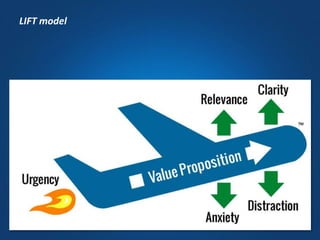
- 33. LIFT model
- 35. PIE Framework Analitika & podatki s trga Tehnično & „politično“ Obisk & stroški EASE IMPORTANCE POTENTIAL
- 37. CRO KOT PROFITNO MESTO
- 38. Projected Incremental Value = (RPV of winning variation x expected traffic over a given period) - (RPV of original x expected traffic over same period) Izračun povečanih prihodkov VISITORS 100 K REVENUE PER VISITOR 1,00 € REVENUE PER VISITOR 1,50 € REVENUE PER VISITOR 1,00 € REVENUE PER VISITOR 1,50 € ADDITIONAL REVENUE 50.000 €
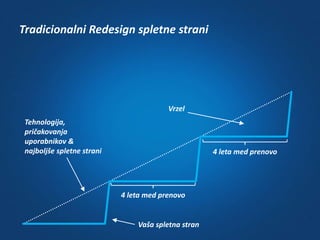
- 39. Tradicionalni Redesign spletne strani Tehnologija, pričakovanja uporabnikov & najboljše spletne strani Vaša spletna stran 4 leta med prenovo 4 leta med prenovo Vrzel
- 40. Evolucijski Redesign spletne strani Nenehen napredek v uporabniški izkušnji in designu
- 41. Hvala andraz.stalec@red-orbit.com Red Orbit, Jožeta Jame 12,1000 Ljubljana, Slovenia W: www.red-orbit.com |E: info@red-orbit.com | T: +386 (0)590 75 680
Editor's Notes
- Even in this case you would need good margin 10.000 visitors with 1 % CR results in 100 transactions. If APV is 30 € your profit is 3.000 €.
- Find the bottlenecks and improvement areas in your conversion funnel Learn: - Which steps drive users to leave your website - Which steps have users leave for other pages - Where users enter your funnel from
- Funnels are non-linear, users move backwards and forwards. See when users move back through your funnel and try to find out why. Learn: - Which steps do users skip? - Which steps do users redo? - What are the top funnel paths?
- Understand where customers are coming from and which acquisition channels to optimize for Learn: - The user split between acquisition channels - How performance differs between channels
- See the devices users use and how adoption changes over time Learn: - The split between device types, specific smartphone types or operating systems, screen sizes - Learn which segments you are performing well for
- See how your users behave in relation to key shopping goals. Segment results to see which user groups are underperforming. Learn: - How many users you lose per step - How individual user groups perform - Which functionalities you need to improve urgently
- See where your users land/leave. Learn: - How your overall landing/exit pages perform over time - How individual pages perform by time on site, exit rate, and more
- See where your users land/leave. Learn: - How your overall landing/exit pages perform over time - How individual pages perform by time on site, exit rate, and more
- Understand your users most common navigation paths Learn: - How users move through your website - Where users land - Which pages have high exit rates
- See where users click on your pages, as well as what their scroll-depth is Learn: - Which elements get the best CTR (note: when multiple buttons share the same URL they share CTR’s here) - What the scroll-depth of your users is - What content underperforms for the amount of screen real estate it has
- See how often site search is used and how much value it adds to your business Learn: - The percentage of users who do or do not use site search, segment by user types - Understand how important site search is to conversion rates and business revenue
- Value Proposition – kakšen Value Proposition aktivira uporabnika Relevance – naredi stran bolj relevantno za uporabnika (glede na STD oz. source in customer need) Clarity – eyeflow & grafični izgled/preglednost Anxiety – znižuje CR (gradnja zaupanja) Distraction – preveč opcij, upsales, cross sales Urgency – zakaj rabim za izdelek sedaj takoj http://www.widerfunnel.com/conversion-rate-optimization/the-six-landing-page-conversion-rate-factors
- Potential How much improvement can be made on the pages? Although I’ve yet to find a page without some potential for improvement, you can’t test everywhere at once and you should prioritize your worst performers. This should take into account your web analytics data, customer data and expert heuristic analysis of user scenarios. Importance How valuable is the traffic to the pages? Your most important pages are the ones with the highest volume and the costliest traffic. You may have identified pages that perform terribly, but if they don’t have significant volume of costly traffic, they aren’t testing priorities. Ease How complicated will the test be to implement on the page or template? The final consideration is the degree of difficulty a test will take to get running on a page, which includes technical implementation and organizational or political barriers. The less time and resources you need to invest for the same return, the better. This includes both technical and “political” ease. A page that would be technically easy may have many stakeholders or vested interests that can cause barriers. I’m looking at you, home page. http://www.widerfunnel.com/conversion-rate-optimization/how-to-prioritize-conversion-rate-optimization-tests-using-pie

