Building Performance Modeling
- 2. Learning ObjectivesDescribe capabilities of building modelingRecognize model outputsBe familiar with when simulation can be used to assist design decisionsUnderstand how modeling analysis can be implemented into your design process
- 3. AgendaEnergy modelingBenchmarks and rating systemsPerformance modelingDesign optimizationIntegrated design processLessons learned
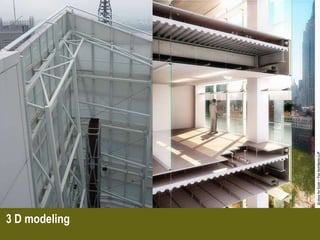
- 4. 3 D modeling
- 5. ≤55%≤73%7%Energy Modeling As We Know It
- 6. What’s good about this building?
- 7. What’s good about this building?
- 11. Window-to-Wall Ratio≤16%≤27%≤38%Glazing Parametric Energy Analysis
- 12. Goal Setting
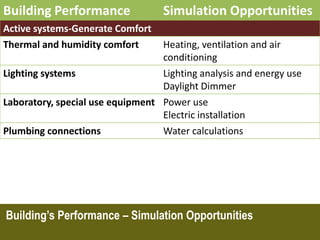
- 13. Building’s Performance – Simulation Opportunities
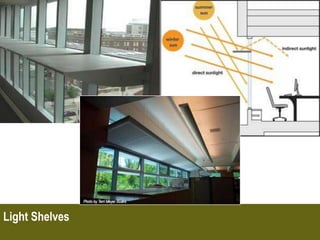
- 14. Light Shelves
- 15. Building’s Performance – Simulation Opportunities
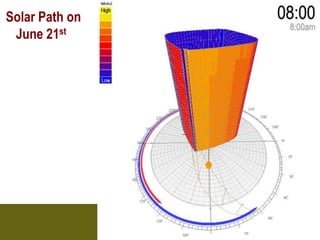
- 17. Solar Path on June 21st
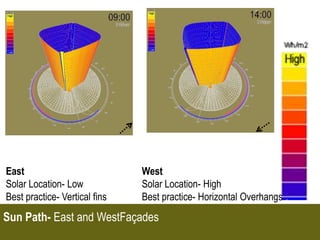
- 18. EastSolar Location- Low Best practice- Vertical finsWestSolar Location- HighBest practice- Horizontal OverhangsSun Path- East and WestFaçades
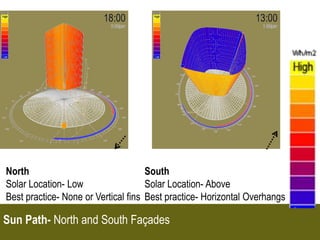
- 19. NorthSolar Location- Low Best practice- None or Vertical finsSouthSolar Location- AboveBest practice- Horizontal OverhangsSun Path- North and South Façades
- 20. Glazing Performance- Sun Ray Vector
- 21. Comfort Optimization- Daylight Analysis
- 22. All Vertical Fins20%All Horizontal ShadesCombination30%40%Shading System Optimization- Solar Radiation Analysis
- 23. 30.1%SavingsOver Baseline31.11%32.4%34.3%Shading System Optimization- Energy Use Analysis
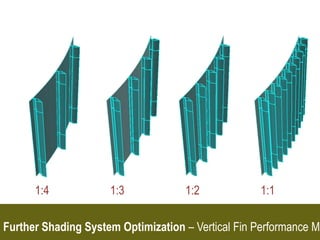
- 24. 1:41:31:21:1Further Shading System Optimization – Vertical Fin Performance Metric
- 25. Depth-to-Distance RatiosHorizontal FinsFinFaçade (~84°)Max Incline Condition1 to 2.8 ratioTower InteriorMax Summer (75.9°)Max Winter (29.0°)FinFaçade (~90°)Typical Condition1 to 3.6 ratioTower InteriorMax Summer (75.9°)Max Winter (29.0°) Shading Fins – Range of Performance
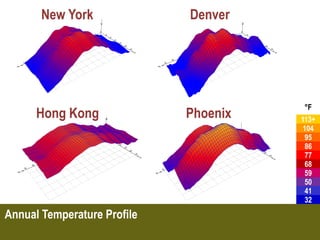
- 27. New YorkDenver°FPhoenixHong Kong113+1049586776859504132Annual Temperature Profile
- 30. Building’s Performance – Simulation Opportunities
- 33. ft/sSite Wind32.0+Strong breezeFresh breeze29.526.222.9Moderate breeze19.716.4Gentle breeze13.1Light breeze9.86.6Calm3.3Ventilation Analysis
- 35. Comparative Analysis- Early Design
- 36. What is a Building?Shelter for occupant comfortWhat is Performance? “The manner in which or the efficiency with which something reacts or fulfills its intended purpose”What is Simulation?Computer program for representation of the behavior or characteristicsWhat is Building Performance Modeling?
- 38. Glazing- Energy Reduction and Daylight Increase
- 39. 100% Glazed50% DaylightAnnual TemperatureCooling load0% Glazed0% DaylightGlazing- Range of Performance
- 40. Optimum daylight Fenestration- Optimized System
- 41. Integrative Team: The Composite Master Builder
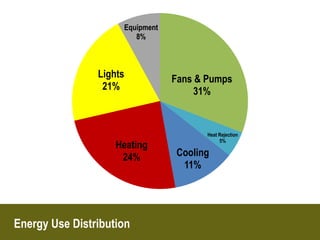
- 42. Active systems: Energy useHVAC
- 43. Lighting
- 44. Plug loadsPassive systems: StructureWalls
- 45. Roofs
- 46. Windows
- 47. Shading SystemINFLUENCEPassive and Active Systems
- 48. Optimization PathwayHVACANDCONTROLSRENEWABLEENERGYSYSTEM SELECTIONENERGY COST BUDGETDEMAND REDUCTIONPARAMETRIC ENERGY USAGEENVELOPE ANDDAYLIGHTRADIATION AND DAYLIGHTORIENTATIONANDPLACEMENTCLIMATE AND CONTEXT12345Model OutputsModeling Analyses for Integrated Design
- 49. Summer Winds–Permeable EnvelopeOperable panes
- 50. Intake, Exhaust ventsWinter Winds– Thermal EnvelopeLow U-value
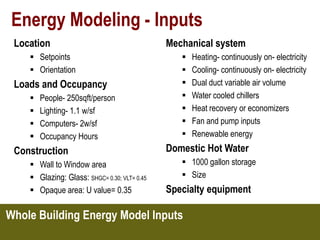
- 53. Energy Modeling - InputsLocationSetpointsOrientationLoads and OccupancyPeople- 250sqft/personLighting- 1.1 w/sfComputers- 2w/sfOccupancy HoursConstructionWall to Window areaGlazing: Glass: SHGC= 0.30; VLT= 0.45Opaque area: U value= 0.35Mechanical systemHeating- continuously on- electricity
- 54. Cooling- continuously on- electricity
- 55. Dual duct variable air volume
- 57. Heat recovery or economizers
- 58. Fan and pump inputs
- 59. Renewable energyDomestic Hot Water1000 gallon storage
- 60. SizeSpecialty equipmentWhole Building Energy Model Inputs
- 61. Whole Building Energy Modeling Results
- 62. Benchmarking Tools and Rating Systems
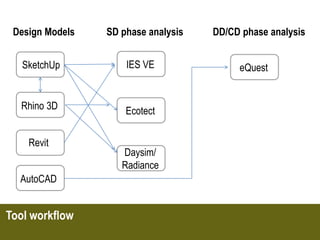
- 63. Design Models SD phase analysis DD/CD phase analysisIES VESketchUpeQuestRhino 3DEcotectRevitDaysim/RadianceAutoCADTool workflow
- 65. YRG sustainabilityconsulting – education – analysiswww.yrgsustainability.comArpanBakshi, Sustainability Managerabakshi@yrgsustainability.comShillpa Singh, Senior Sustainability Managerssingh@yrgsustainability.com
Editor's Notes
- To be completed
- To be Completed
- The building is oriented along an east-west axis to maximize the use of daylight and natural ventilation. North-facing clearstory glazingShaded southern vision glazing and south-facing light shelves
- The current model will show
- Building form, mass, orientation, contextEvaluate benefit of architectural features like sun shades
- These reuslts are produced with a combination of simulations run in Dubai climate. These are the assumption taken for the model. May or may not be shared


