Location via proxy:   [ UP ]  
[Report a bug]   [Manage cookies]                
SlideShare a Scribd company logo
1

© This is a licensed product of AM Mindpower Solutions and should not be copied
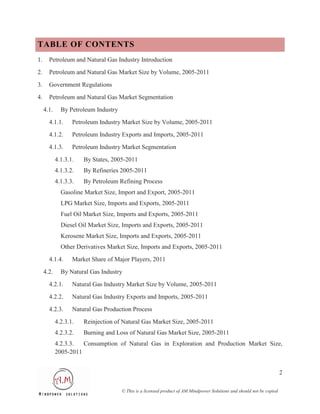
TABLE OF CONTENTS
1.     Petroleum and Natural Gas Industry Introduction
2.     Petroleum and Natural Gas Market Size by Volume, 2005-2011
3.     Government Regulations
4.     Petroleum and Natural Gas Market Segmentation
     4.1.     By Petroleum Industry
       4.1.1.      Petroleum Industry Market Size by Volume, 2005-2011
       4.1.2.      Petroleum Industry Exports and Imports, 2005-2011
       4.1.3.      Petroleum Industry Market Segmentation
            4.1.3.1.   By States, 2005-2011
            4.1.3.2.   By Refineries 2005-2011
            4.1.3.3.   By Petroleum Refining Process
              Gasoline Market Size, Import and Export, 2005-2011
              LPG Market Size, Imports and Exports, 2005-2011
              Fuel Oil Market Size, Imports and Exports, 2005-2011
              Diesel Oil Market Size, Imports and Exports, 2005-2011
              Kerosene Market Size, Imports and Exports, 2005-2011
              Other Derivatives Market Size, Imports and Exports, 2005-2011
       4.1.4.      Market Share of Major Players, 2011
     4.2.     By Natural Gas Industry
       4.2.1.      Natural Gas Industry Market Size by Volume, 2005-2011
       4.2.2.      Natural Gas Industry Exports and Imports, 2005-2011
       4.2.3.      Natural Gas Production Process
            4.2.3.1.   Reinjection of Natural Gas Market Size, 2005-2011
            4.2.3.2.   Burning and Loss of Natural Gas Market Size, 2005-2011
            4.2.3.3.  Consumption of Natural Gas in Exploration and Production Market Size,
            2005-2011


                                                                                                                        2

                                      © This is a licensed product of AM Mindpower Solutions and should not be copied
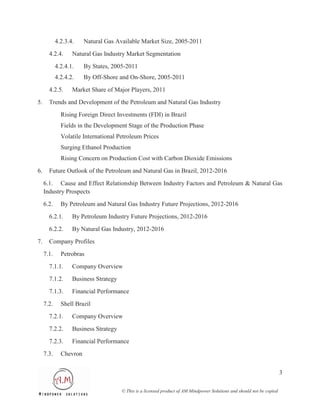
4.2.3.4.    Natural Gas Available Market Size, 2005-2011
       4.2.4.      Natural Gas Industry Market Segmentation
            4.2.4.1.    By States, 2005-2011
            4.2.4.2.    By Off-Shore and On-Shore, 2005-2011
       4.2.5.      Market Share of Major Players, 2011
5.     Trends and Development of the Petroleum and Natural Gas Industry
              Rising Foreign Direct Investments (FDI) in Brazil
              Fields in the Development Stage of the Production Phase
              Volatile International Petroleum Prices
              Surging Ethanol Production
              Rising Concern on Production Cost with Carbon Dioxide Emissions
6.     Future Outlook of the Petroleum and Natural Gas in Brazil, 2012-2016

     6.1. Cause and Effect Relationship Between Industry Factors and Petroleum & Natural Gas
     Industry Prospects
     6.2.     By Petroleum and Natural Gas Industry Future Projections, 2012-2016
       6.2.1.      By Petroleum Industry Future Projections, 2012-2016
       6.2.2.      By Natural Gas Industry, 2012-2016
7.     Company Profiles
     7.1.     Petrobras
       7.1.1.      Company Overview
       7.1.2.      Business Strategy
       7.1.3.      Financial Performance
     7.2.     Shell Brazil
       7.2.1.      Company Overview
       7.2.2.      Business Strategy
       7.2.3.      Financial Performance
     7.3.     Chevron

                                                                                                                         3

                                       © This is a licensed product of AM Mindpower Solutions and should not be copied
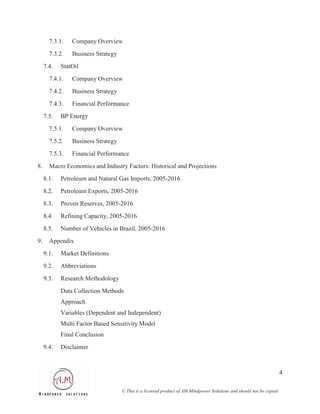
7.3.1.   Company Overview
       7.3.2.   Business Strategy
     7.4.   StatOil
       7.4.1.   Company Overview
       7.4.2.   Business Strategy
       7.4.3.   Financial Performance
     7.5.   BP Energy
       7.5.1.   Company Overview
       7.5.2.   Business Strategy
       7.5.3.   Financial Performance
8.     Macro Economics and Industry Factors: Historical and Projections
     8.1.   Petroleum and Natural Gas Imports, 2005-2016
     8.2.   Petroleum Exports, 2005-2016
     8.3.   Proven Reserves, 2005-2016
     8.4.   Refining Capacity, 2005-2016
     8.5.   Number of Vehicles in Brazil, 2005-2016
9.     Appendix
     9.1.   Market Definitions
     9.2.   Abbreviations
     9.3.   Research Methodology
            Data Collection Methods
            Approach
            Variables (Dependent and Independent)
            Multi Factor Based Sensitivity Model
            Final Conclusion
     9.4.   Disclaimer


                                                                                                                      4

                                    © This is a licensed product of AM Mindpower Solutions and should not be copied
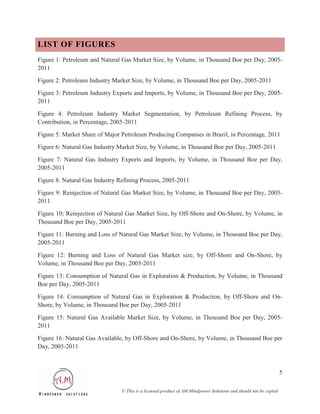
LIST OF FIGURES
Figure 1: Petroleum and Natural Gas Market Size, by Volume, in Thousand Boe per Day, 2005-
2011
Figure 2: Petroleum Industry Market Size, by Volume, in Thousand Boe per Day, 2005-2011

Figure 3: Petroleum Industry Exports and Imports, by Volume, in Thousand Boe per Day, 2005-
2011

Figure 4: Petroleum Industry Market Segmentation, by Petroleum Refining Process, by
Contribution, in Percentage, 2005-2011
Figure 5: Market Share of Major Petroleum Producing Companies in Brazil, in Percentage, 2011
Figure 6: Natural Gas Industry Market Size, by Volume, in Thousand Boe per Day, 2005-2011

Figure 7: Natural Gas Industry Exports and Imports, by Volume, in Thousand Boe per Day,
2005-2011
Figure 8: Natural Gas Industry Refining Process, 2005-2011

Figure 9: Reinjection of Natural Gas Market Size, by Volume, in Thousand Boe per Day, 2005-
2011
Figure 10; Reinjection of Natural Gas Market Size, by Off-Shore and On-Shore, by Volume, in
Thousand Boe per Day, 2005-2011
Figure 11: Burning and Loss of Natural Gas Market Size, by Volume, in Thousand Boe per Day,
2005-2011

Figure 12: Burning and Loss of Natural Gas Market size, by Off-Shore and On-Shore, by
Volume, in Thousand Boe per Day, 2005-2011
Figure 13: Consumption of Natural Gas in Exploration & Production, by Volume, in Thousand
Boe per Day, 2005-2011

Figure 14: Consumption of Natural Gas in Exploration & Production, by Off-Shore and On-
Shore, by Volume, in Thousand Boe per Day, 2005-2011

Figure 15: Natural Gas Available Market Size, by Volume, in Thousand Boe per Day, 2005-
2011

Figure 16: Natural Gas Available, by Off-Shore and On-Shore, by Volume, in Thousand Boe per
Day, 2005-2011


                                                                                                                  5

                                © This is a licensed product of AM Mindpower Solutions and should not be copied
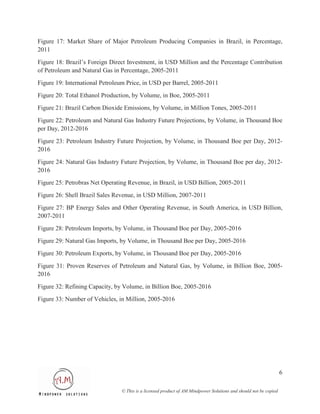
Figure 17: Market Share of Major Petroleum Producing Companies in Brazil, in Percentage,
2011

Figure 18: Brazil’s Foreign Direct Investment, in USD Million and the Percentage Contribution
of Petroleum and Natural Gas in Percentage, 2005-2011
Figure 19: International Petroleum Price, in USD per Barrel, 2005-2011
Figure 20: Total Ethanol Production, by Volume, in Boe, 2005-2011
Figure 21: Brazil Carbon Dioxide Emissions, by Volume, in Million Tones, 2005-2011

Figure 22: Petroleum and Natural Gas Industry Future Projections, by Volume, in Thousand Boe
per Day, 2012-2016

Figure 23: Petroleum Industry Future Projection, by Volume, in Thousand Boe per Day, 2012-
2016
Figure 24: Natural Gas Industry Future Projection, by Volume, in Thousand Boe per day, 2012-
2016
Figure 25: Petrobras Net Operating Revenue, in Brazil, in USD Billion, 2005-2011
Figure 26: Shell Brazil Sales Revenue, in USD Million, 2007-2011

Figure 27: BP Energy Sales and Other Operating Revenue, in South America, in USD Billion,
2007-2011
Figure 28: Petroleum Imports, by Volume, in Thousand Boe per Day, 2005-2016
Figure 29: Natural Gas Imports, by Volume, in Thousand Boe per Day, 2005-2016
Figure 30: Petroleum Exports, by Volume, in Thousand Boe per Day, 2005-2016

Figure 31: Proven Reserves of Petroleum and Natural Gas, by Volume, in Billion Boe, 2005-
2016
Figure 32: Refining Capacity, by Volume, in Billion Boe, 2005-2016
Figure 33: Number of Vehicles, in Million, 2005-2016


                                                                                                                  6

                                © This is a licensed product of AM Mindpower Solutions and should not be copied
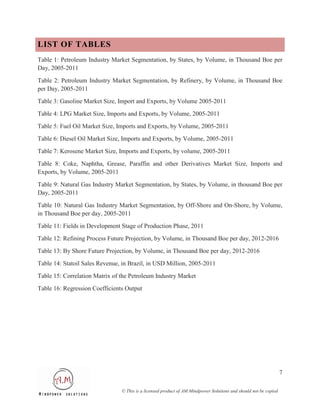
LIST OF TABLES
Table 1: Petroleum Industry Market Segmentation, by States, by Volume, in Thousand Boe per
Day, 2005-2011

Table 2: Petroleum Industry Market Segmentation, by Refinery, by Volume, in Thousand Boe
per Day, 2005-2011
Table 3: Gasoline Market Size, Import and Exports, by Volume 2005-2011
Table 4: LPG Market Size, Imports and Exports, by Volume, 2005-2011
Table 5: Fuel Oil Market Size, Imports and Exports, by Volume, 2005-2011
Table 6: Diesel Oil Market Size, Imports and Exports, by Volume, 2005-2011
Table 7: Kerosene Market Size, Imports and Exports, by volume, 2005-2011

Table 8: Coke, Naphtha, Grease, Paraffin and other Derivatives Market Size, Imports and
Exports, by Volume, 2005-2011

Table 9: Natural Gas Industry Market Segmentation, by States, by Volume, in thousand Boe per
Day, 2005-2011

Table 10: Natural Gas Industry Market Segmentation, by Off-Shore and On-Shore, by Volume,
in Thousand Boe per day, 2005-2011
Table 11: Fields in Development Stage of Production Phase, 2011
Table 12: Refining Process Future Projection, by Volume, in Thousand Boe per day, 2012-2016
Table 13: By Shore Future Projection, by Volume, in Thousand Boe per day, 2012-2016
Table 14: Statoil Sales Revenue, in Brazil, in USD Million, 2005-2011
Table 15: Correlation Matrix of the Petroleum Industry Market
Table 16: Regression Coefficients Output


                                                                                                                  7

                                © This is a licensed product of AM Mindpower Solutions and should not be copied
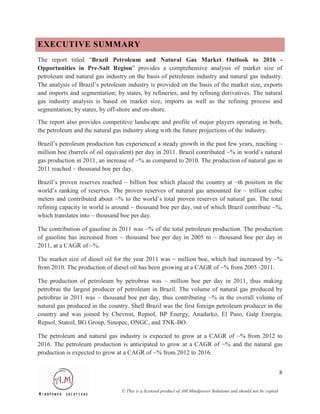
EXECUTIVE SUMMARY
The report titled “Brazil Petroleum and Natural Gas Market Outlook to 2016 -
Opportunities in Pre-Salt Region” provides a comprehensive analysis of market size of
petroleum and natural gas industry on the basis of petroleum industry and natural gas industry.
The analysis of Brazil’s petroleum industry is provided on the basis of the market size, exports
and imports and segmentation; by states, by refineries, and by refining derivatives. The natural
gas industry analysis is based on market size, imports as well as the refining process and
segmentation; by states, by off-shore and on-shore.

The report also provides competitive landscape and profile of major players operating in both,
the petroleum and the natural gas industry along with the future projections of the industry.

Brazil’s petroleum production has experienced a steady growth in the past few years, reaching ~
million boe (barrels of oil equivalent) per day in 2011. Brazil contributed ~% in world’s natural
gas production in 2011, an increase of ~% as compared to 2010. The production of natural gas in
2011 reached ~ thousand boe per day.

Brazil’s proven reserves reached ~ billion boe which placed the country at ~th position in the
world’s ranking of reserves. The proven reserves of natural gas amounted for ~ trillion cubic
meters and contributed about ~% to the world’s total proven reserves of natural gas. The total
refining capacity in world is around ~ thousand boe per day, out of which Brazil contribute ~%,
which translates into ~ thousand boe per day.

The contribution of gasoline in 2011 was ~% of the total petroleum production. The production
of gasoline has increased from ~ thousand boe per day in 2005 to ~ thousand boe per day in
2011, at a CAGR of ~%.

The market size of diesel oil for the year 2011 was ~ million boe, which had increased by ~%
from 2010. The production of diesel oil has been growing at a CAGR of ~% from 2005 -2011.

The production of petroleum by petrobras was ~ million boe per day in 2011, thus making
petrobras the largest producer of petroleum in Brazil. The volume of natural gas produced by
petrobras in 2011 was ~ thousand boe per day, thus contributing ~% in the overall volume of
natural gas produced in the country. Shell Brazil was the first foreign petroleum producer in the
country and was joined by Chevron, Repsol, BP Energy, Anadarko, El Paso, Galp Energia,
Repsol, Statoil, BG Group, Sinopec, ONGC, and TNK-BO.

The petroleum and natural gas industry is expected to grow at a CAGR of ~% from 2012 to
2016. The petroleum production is anticipated to grow at a CAGR of ~% and the natural gas
production is expected to grow at a CAGR of ~% from 2012 to 2016.


                                                                                                                   8

                                 © This is a licensed product of AM Mindpower Solutions and should not be copied
Key Topics Covered in the Report:

   -   Market size of Brazil’s petroleum and natural gas industry, on the basis of volume
   -   The Government regulation in Brazil’s petroleum and natural gas industry
   -   Market size and the imports and exports of Brazil’s petroleum industry, on the basis of
       volume
   -   Brazil’s petroleum industry market segmentation, according to the states, refineries and
       according to refining process and the refining process of petroleum
   -   Market size and the imports and exports of petroleum derivatives (gasoline, fuel oil, LPG,
       kerosene, diesel oil and other derivatives) in Brazil, on the basis of volume
   -   Market size of natural gas used for reinjection, natural gas burned and consumed in
       production process and the natural gas available and the refining process of natural gas
   -   The imports of natural gas in Brazil
   -   Market segmentation of natural gas industry, according to the states and the regions
   -   The trends and development in the past and their effect on the Brazil’s petroleum and
       natural gas industry
   -   The future outlook, cause and effect of various factors which have an impact on the
       industry and the future projections of both the petroleum industry and the natural gas
       industry
   -   The market share of major players in the petroleum and natural gas industry and the
       company profiles of these major players
   -   The historical and the projected trends in the macro-economic indicators, which had an
       impact on the petroleum and natural gas industry of Brazil.


                                                                                                                  9

                                © This is a licensed product of AM Mindpower Solutions and should not be copied
More Related Content

Brazil petroleum and natural gas market outlook to 2016 executive summary

  • 1. 1 © This is a licensed product of AM Mindpower Solutions and should not be copied
  • 2. TABLE OF CONTENTS 1. Petroleum and Natural Gas Industry Introduction 2. Petroleum and Natural Gas Market Size by Volume, 2005-2011 3. Government Regulations 4. Petroleum and Natural Gas Market Segmentation 4.1. By Petroleum Industry 4.1.1. Petroleum Industry Market Size by Volume, 2005-2011 4.1.2. Petroleum Industry Exports and Imports, 2005-2011 4.1.3. Petroleum Industry Market Segmentation 4.1.3.1. By States, 2005-2011 4.1.3.2. By Refineries 2005-2011 4.1.3.3. By Petroleum Refining Process Gasoline Market Size, Import and Export, 2005-2011 LPG Market Size, Imports and Exports, 2005-2011 Fuel Oil Market Size, Imports and Exports, 2005-2011 Diesel Oil Market Size, Imports and Exports, 2005-2011 Kerosene Market Size, Imports and Exports, 2005-2011 Other Derivatives Market Size, Imports and Exports, 2005-2011 4.1.4. Market Share of Major Players, 2011 4.2. By Natural Gas Industry 4.2.1. Natural Gas Industry Market Size by Volume, 2005-2011 4.2.2. Natural Gas Industry Exports and Imports, 2005-2011 4.2.3. Natural Gas Production Process 4.2.3.1. Reinjection of Natural Gas Market Size, 2005-2011 4.2.3.2. Burning and Loss of Natural Gas Market Size, 2005-2011 4.2.3.3. Consumption of Natural Gas in Exploration and Production Market Size, 2005-2011 2 © This is a licensed product of AM Mindpower Solutions and should not be copied
  • 3. 4.2.3.4. Natural Gas Available Market Size, 2005-2011 4.2.4. Natural Gas Industry Market Segmentation 4.2.4.1. By States, 2005-2011 4.2.4.2. By Off-Shore and On-Shore, 2005-2011 4.2.5. Market Share of Major Players, 2011 5. Trends and Development of the Petroleum and Natural Gas Industry Rising Foreign Direct Investments (FDI) in Brazil Fields in the Development Stage of the Production Phase Volatile International Petroleum Prices Surging Ethanol Production Rising Concern on Production Cost with Carbon Dioxide Emissions 6. Future Outlook of the Petroleum and Natural Gas in Brazil, 2012-2016 6.1. Cause and Effect Relationship Between Industry Factors and Petroleum & Natural Gas Industry Prospects 6.2. By Petroleum and Natural Gas Industry Future Projections, 2012-2016 6.2.1. By Petroleum Industry Future Projections, 2012-2016 6.2.2. By Natural Gas Industry, 2012-2016 7. Company Profiles 7.1. Petrobras 7.1.1. Company Overview 7.1.2. Business Strategy 7.1.3. Financial Performance 7.2. Shell Brazil 7.2.1. Company Overview 7.2.2. Business Strategy 7.2.3. Financial Performance 7.3. Chevron 3 © This is a licensed product of AM Mindpower Solutions and should not be copied
  • 4. 7.3.1. Company Overview 7.3.2. Business Strategy 7.4. StatOil 7.4.1. Company Overview 7.4.2. Business Strategy 7.4.3. Financial Performance 7.5. BP Energy 7.5.1. Company Overview 7.5.2. Business Strategy 7.5.3. Financial Performance 8. Macro Economics and Industry Factors: Historical and Projections 8.1. Petroleum and Natural Gas Imports, 2005-2016 8.2. Petroleum Exports, 2005-2016 8.3. Proven Reserves, 2005-2016 8.4. Refining Capacity, 2005-2016 8.5. Number of Vehicles in Brazil, 2005-2016 9. Appendix 9.1. Market Definitions 9.2. Abbreviations 9.3. Research Methodology Data Collection Methods Approach Variables (Dependent and Independent) Multi Factor Based Sensitivity Model Final Conclusion 9.4. Disclaimer 4 © This is a licensed product of AM Mindpower Solutions and should not be copied
  • 5. LIST OF FIGURES Figure 1: Petroleum and Natural Gas Market Size, by Volume, in Thousand Boe per Day, 2005- 2011 Figure 2: Petroleum Industry Market Size, by Volume, in Thousand Boe per Day, 2005-2011 Figure 3: Petroleum Industry Exports and Imports, by Volume, in Thousand Boe per Day, 2005- 2011 Figure 4: Petroleum Industry Market Segmentation, by Petroleum Refining Process, by Contribution, in Percentage, 2005-2011 Figure 5: Market Share of Major Petroleum Producing Companies in Brazil, in Percentage, 2011 Figure 6: Natural Gas Industry Market Size, by Volume, in Thousand Boe per Day, 2005-2011 Figure 7: Natural Gas Industry Exports and Imports, by Volume, in Thousand Boe per Day, 2005-2011 Figure 8: Natural Gas Industry Refining Process, 2005-2011 Figure 9: Reinjection of Natural Gas Market Size, by Volume, in Thousand Boe per Day, 2005- 2011 Figure 10; Reinjection of Natural Gas Market Size, by Off-Shore and On-Shore, by Volume, in Thousand Boe per Day, 2005-2011 Figure 11: Burning and Loss of Natural Gas Market Size, by Volume, in Thousand Boe per Day, 2005-2011 Figure 12: Burning and Loss of Natural Gas Market size, by Off-Shore and On-Shore, by Volume, in Thousand Boe per Day, 2005-2011 Figure 13: Consumption of Natural Gas in Exploration & Production, by Volume, in Thousand Boe per Day, 2005-2011 Figure 14: Consumption of Natural Gas in Exploration & Production, by Off-Shore and On- Shore, by Volume, in Thousand Boe per Day, 2005-2011 Figure 15: Natural Gas Available Market Size, by Volume, in Thousand Boe per Day, 2005- 2011 Figure 16: Natural Gas Available, by Off-Shore and On-Shore, by Volume, in Thousand Boe per Day, 2005-2011 5 © This is a licensed product of AM Mindpower Solutions and should not be copied
  • 6. Figure 17: Market Share of Major Petroleum Producing Companies in Brazil, in Percentage, 2011 Figure 18: Brazil’s Foreign Direct Investment, in USD Million and the Percentage Contribution of Petroleum and Natural Gas in Percentage, 2005-2011 Figure 19: International Petroleum Price, in USD per Barrel, 2005-2011 Figure 20: Total Ethanol Production, by Volume, in Boe, 2005-2011 Figure 21: Brazil Carbon Dioxide Emissions, by Volume, in Million Tones, 2005-2011 Figure 22: Petroleum and Natural Gas Industry Future Projections, by Volume, in Thousand Boe per Day, 2012-2016 Figure 23: Petroleum Industry Future Projection, by Volume, in Thousand Boe per Day, 2012- 2016 Figure 24: Natural Gas Industry Future Projection, by Volume, in Thousand Boe per day, 2012- 2016 Figure 25: Petrobras Net Operating Revenue, in Brazil, in USD Billion, 2005-2011 Figure 26: Shell Brazil Sales Revenue, in USD Million, 2007-2011 Figure 27: BP Energy Sales and Other Operating Revenue, in South America, in USD Billion, 2007-2011 Figure 28: Petroleum Imports, by Volume, in Thousand Boe per Day, 2005-2016 Figure 29: Natural Gas Imports, by Volume, in Thousand Boe per Day, 2005-2016 Figure 30: Petroleum Exports, by Volume, in Thousand Boe per Day, 2005-2016 Figure 31: Proven Reserves of Petroleum and Natural Gas, by Volume, in Billion Boe, 2005- 2016 Figure 32: Refining Capacity, by Volume, in Billion Boe, 2005-2016 Figure 33: Number of Vehicles, in Million, 2005-2016 6 © This is a licensed product of AM Mindpower Solutions and should not be copied
  • 7. LIST OF TABLES Table 1: Petroleum Industry Market Segmentation, by States, by Volume, in Thousand Boe per Day, 2005-2011 Table 2: Petroleum Industry Market Segmentation, by Refinery, by Volume, in Thousand Boe per Day, 2005-2011 Table 3: Gasoline Market Size, Import and Exports, by Volume 2005-2011 Table 4: LPG Market Size, Imports and Exports, by Volume, 2005-2011 Table 5: Fuel Oil Market Size, Imports and Exports, by Volume, 2005-2011 Table 6: Diesel Oil Market Size, Imports and Exports, by Volume, 2005-2011 Table 7: Kerosene Market Size, Imports and Exports, by volume, 2005-2011 Table 8: Coke, Naphtha, Grease, Paraffin and other Derivatives Market Size, Imports and Exports, by Volume, 2005-2011 Table 9: Natural Gas Industry Market Segmentation, by States, by Volume, in thousand Boe per Day, 2005-2011 Table 10: Natural Gas Industry Market Segmentation, by Off-Shore and On-Shore, by Volume, in Thousand Boe per day, 2005-2011 Table 11: Fields in Development Stage of Production Phase, 2011 Table 12: Refining Process Future Projection, by Volume, in Thousand Boe per day, 2012-2016 Table 13: By Shore Future Projection, by Volume, in Thousand Boe per day, 2012-2016 Table 14: Statoil Sales Revenue, in Brazil, in USD Million, 2005-2011 Table 15: Correlation Matrix of the Petroleum Industry Market Table 16: Regression Coefficients Output 7 © This is a licensed product of AM Mindpower Solutions and should not be copied
  • 8. EXECUTIVE SUMMARY The report titled “Brazil Petroleum and Natural Gas Market Outlook to 2016 - Opportunities in Pre-Salt Region” provides a comprehensive analysis of market size of petroleum and natural gas industry on the basis of petroleum industry and natural gas industry. The analysis of Brazil’s petroleum industry is provided on the basis of the market size, exports and imports and segmentation; by states, by refineries, and by refining derivatives. The natural gas industry analysis is based on market size, imports as well as the refining process and segmentation; by states, by off-shore and on-shore. The report also provides competitive landscape and profile of major players operating in both, the petroleum and the natural gas industry along with the future projections of the industry. Brazil’s petroleum production has experienced a steady growth in the past few years, reaching ~ million boe (barrels of oil equivalent) per day in 2011. Brazil contributed ~% in world’s natural gas production in 2011, an increase of ~% as compared to 2010. The production of natural gas in 2011 reached ~ thousand boe per day. Brazil’s proven reserves reached ~ billion boe which placed the country at ~th position in the world’s ranking of reserves. The proven reserves of natural gas amounted for ~ trillion cubic meters and contributed about ~% to the world’s total proven reserves of natural gas. The total refining capacity in world is around ~ thousand boe per day, out of which Brazil contribute ~%, which translates into ~ thousand boe per day. The contribution of gasoline in 2011 was ~% of the total petroleum production. The production of gasoline has increased from ~ thousand boe per day in 2005 to ~ thousand boe per day in 2011, at a CAGR of ~%. The market size of diesel oil for the year 2011 was ~ million boe, which had increased by ~% from 2010. The production of diesel oil has been growing at a CAGR of ~% from 2005 -2011. The production of petroleum by petrobras was ~ million boe per day in 2011, thus making petrobras the largest producer of petroleum in Brazil. The volume of natural gas produced by petrobras in 2011 was ~ thousand boe per day, thus contributing ~% in the overall volume of natural gas produced in the country. Shell Brazil was the first foreign petroleum producer in the country and was joined by Chevron, Repsol, BP Energy, Anadarko, El Paso, Galp Energia, Repsol, Statoil, BG Group, Sinopec, ONGC, and TNK-BO. The petroleum and natural gas industry is expected to grow at a CAGR of ~% from 2012 to 2016. The petroleum production is anticipated to grow at a CAGR of ~% and the natural gas production is expected to grow at a CAGR of ~% from 2012 to 2016. 8 © This is a licensed product of AM Mindpower Solutions and should not be copied
  • 9. Key Topics Covered in the Report: - Market size of Brazil’s petroleum and natural gas industry, on the basis of volume - The Government regulation in Brazil’s petroleum and natural gas industry - Market size and the imports and exports of Brazil’s petroleum industry, on the basis of volume - Brazil’s petroleum industry market segmentation, according to the states, refineries and according to refining process and the refining process of petroleum - Market size and the imports and exports of petroleum derivatives (gasoline, fuel oil, LPG, kerosene, diesel oil and other derivatives) in Brazil, on the basis of volume - Market size of natural gas used for reinjection, natural gas burned and consumed in production process and the natural gas available and the refining process of natural gas - The imports of natural gas in Brazil - Market segmentation of natural gas industry, according to the states and the regions - The trends and development in the past and their effect on the Brazil’s petroleum and natural gas industry - The future outlook, cause and effect of various factors which have an impact on the industry and the future projections of both the petroleum industry and the natural gas industry - The market share of major players in the petroleum and natural gas industry and the company profiles of these major players - The historical and the projected trends in the macro-economic indicators, which had an impact on the petroleum and natural gas industry of Brazil. 9 © This is a licensed product of AM Mindpower Solutions and should not be copied