


Bridging the Last Mile: Getting Data to the People Who Need It (APAC)
- 1. DATA VIRTUALIZATION APAC WEBINAR SERIES Sessions Covering Key Data Integration Challenges Solved with Data Virtualization
- 2. Bridging the Last Mile: Getting Data to the People Who Need It Chris Day Director, APAC Sales Engineering, Denodo Sushant Kumar Product Marketing Manager, Denodo
- 3. Agenda 1. What is the “Last Mile”? 2. Logical Architecture to the Rescue 3. Data Virtualization as a Data Access Layer 4. Product Demo 5. Q&A 6. Next Steps
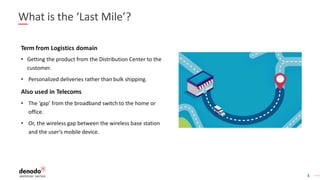
- 4. 4 What is the ‘Last Mile’? Term from Logistics domain • Getting the product from the Distribution Center to the customer. • Personalized deliveries rather than bulk shipping. Also used in Telecoms • The ‘gap’ from the broadband switch to the home or office. • Or, the wireless gap between the wireless base station and the user’s mobile device.
- 5. 5 Why is the Last Mile Important? This is delivering the requested product to the customer • In our case, delivering data to the user. • Change from bulk movement of data (ETL/ELT)to delivering data specific to users needs. This used to be ‘Data Marts’ – extracted subsets of data for a specific use. But, the information ‘landscape’ is getting more complex, more diverse, and more distributed. • The old ETL to the Data Warehouse and then ETLto create Data Marts doesn’t cut it anymore… Data Warehouse Data Mart Data Mart Data Mart
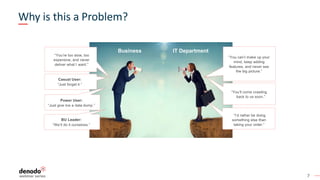
- 7. 7 IT DepartmentBusiness “You’re too slow, too expensive, and never deliver what I want.” “You can’t make up your mind, keep adding features, and never see the big picture.” Casual User: “Just forget it.” Power User: “Just give me a data dump.” BU Leader: “We’ll do it ourselves.” “I’d rather be doing something else than taking your order.” “You’ll come crawling back to us soon.” Why is this a Problem?
- 8. 8 Gartner – The Evolution of Analytical Environments This is a Second Major Cycle of Analytical Consolidation Operational Application Operational Application Operational Application IoT Data Other NewData Operational Application Operational Application Cube Operational Application Cube ? Operational Application Operational Application Operational Application IoT Data Other NewData 1980s Pre EDW 1990s EDW 2010s2000s Post EDW Time LDW Operational Application Operational Application Operational Application Data Warehouse Data Warehouse Data Lake ? Logical Data Warehouse Data Warehouse Data Lake Marts ODS Staging/Ingest Unified analysis › Consolidated data › "Collect the data" › Single server, multiple nodes › More analysis than any one server can provide ©2018 Gartner, Inc. Unified analysis › Logically consolidated view of all data › "Connect and collect" › Multiple servers, of multiple nodes › More analysis than any one system can provide ID: 342254 Fragmented/ nonexistent analysis › Multiple sources › Multiple structured sources Fragmented analysis › "Collect the data" (Into › different repositories) › New data types, › processing, requirements › Uncoordinated views
- 9. 10 Gartner – Logical Data Warehouse “Adopt the Logical Data Warehouse Architecture to Meet Your Modern Analytical Needs”. Henry Cook, Gartner April 2018 DATA VIRTUALIZATION
- 10. 11 - Gartner, Adopt the Logical Data Warehouse Architecture to Meet Your Modern Analytical Needs, May 2018 “When designed properly, Data Virtualization can speed data integration, lower data latency, offer flexibility and reuse, and reduce data sprawl across dispersed data sources. Due to its many benefits, Data Virtualization is often the first step for organizations evolving a traditional, repository-style data warehouse into a Logical Architecture”
- 11. 12 Benefits of a Virtual Data Layer § A Virtual Layer improves decision making and shortens development cycles • Surfaces all company data from multiple repositories without the need to replicate all data into a data warehouse or data lake. • Eliminates data silos allows for on-demand combination of data from multiple sources. § A Virtual Layer broadens usage of data • Improves governance and metadata management to avoid “data swamps”. • Decouples data source technology. Access normalized via SQL or web services. • Allows controlled access to the data with low grain security controls. § A Virtual Layer offers performant access • Leverages the processing power of the existing sources controlled by Denodo’s optimizer. • Processing of data for sources with no processing capabilities (e.g. files) • Caching and ingestion engine to persist data when needed. TTV USAGE PERFORMANCE
- 12. Customer Story
- 13. 14 Customer Case Study – Festo THE CHALLENGE: Find an agile way to integrate data from existing silos, including data warehouse, machine data, and others, that will reduce dependencies from business users on IT and provides quick turnaround and flexibility. BUSINESS NEEDS: • Optimize operational efficiency, automate manufacturing processes, and deliver on-demand services to business consumers. • Find smarter ways to aggregate and analyze data. • An agile solution that enables the monetization of customer-facing data products. • Free business users from IT reliance to become self-sufficient with reporting and analysis. • Founded 1925 • Annual Revenue (FY 2018) €3.2B • Over 21,000 employees • Headquarters in Germany • World’s leading supplier of automation technology
- 14. 15 Festo’s Solution Architecture on Denodo Platform SOLUTION: • Festo developed a Big Data Analytics Framework to provide a data marketplace to better support the business. • Using the Denodo Platform to integrate data from numerous on-prem and cloud systems in real-time. • A unified layer for consistent data access and governance across different data silos.
- 15. Product Demonstration Chris Day Director, APAC Sales Engineering, Denodo
- 17. 18 Users and personas Denodo Developer Business User BI Analyst Data Scientist IT Operations
- 18. How to set up Denodo Connectivity and Modeling
- 19. 22 Example Historical sales based on specific Marketing Campaign § Historical sales data offloaded to Hadoop cluster for cheaper storage § Marketing campaigns managed in an external cloud app § Country is part of the customer details table, stored in the DW Sources Combine, Transform & Integrate Consume Base View Source Abstraction join group by state join Sales Campaign Customer
- 20. Denodo Developer Data Catalog Dev Studio Management BI & Reporting Predictive Analytics AI/ML
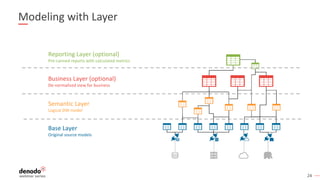
- 21. 24 Base Layer Original source models Semantic Layer Logical DW model Business Layer (optional) De-normalized view for business Reporting Layer (optional) Pre-canned reports with calculated metrics Modeling with Layer
- 22. How Does Execution Work
- 23. 26 What is the Scenario? The DV system only stores Metadata Data is external • Needs to travel through the Network • To address: minimize network traffic Data is distributed in multiple systems • Needs to be integrated in the virtual layer • Some sources have processing capabilities • To address: maximize processing at sources to reduce load in virtualization layer
- 24. 27 What Information Do We Have? 1. The incoming query (SQL) 2. Table metadata § Source, PK, FK, indexes, “virtual” partitions, etc. 3. Data statistics § Used by the Cost Based Optimizer to estimating data volumes 4. Source capabilities § Can the source process data? (eg. RDBMS vs. CSV file) § “Read-Only” vs. “Can create temp tables” § In an MPP, size of the cluster
- 25. 28 What is the Optimizer Doing? SELECT c.state, AVG(s.amount) FROM customer c JOIN sales s ON c.id = s.customer_id GROUP BY c.state Sales Customer join group by Sales Customer Create temp table join group by Option 1? Option 2? Option 3? Temp_Customer Customer and Sales are in different sources. What is the best execution plan? Naïve Strategy Temporary Data Movement 300 M 2 M 2 M 50 M Sales Customer join group by ID Group by state Partial Aggregation Pushdown 2 M 2 M ‘Cost’ ~302 M ‘Cost’ ~52 M ‘Cost’ ~4 M
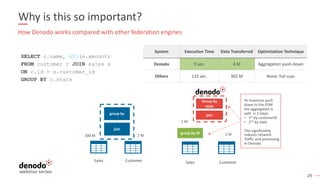
- 26. 29 Why is this so important? SELECT c.name, AVG(s.amount) FROM customer c JOIN sales s ON c.id = s.customer_id GROUP BY c.state How Denodo works compared with other federation engines System Execution Time Data Transferred Optimization Technique Denodo 9 sec. 4 M Aggregation push-down Others 125 sec. 302 M None: full scan 300 M 2 M Sales Customer join group by 2 M 2 M Sales Customer join group by ID Group by state To maximize push down to the EDW the aggregation is split in 2 steps: • 1st by customerID • 2nd by state This significantly reduces network Traffic and processing In Denodo
- 27. Business User Data Catalog Dev Studio Management BI & Reporting Predictive Analytics AI/ML
- 28. 31 Denodo Data Catalog 7.0
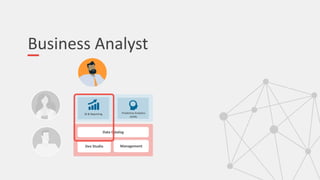
- 30. Business Analyst Data Catalog Dev Studio Management BI & Reporting Predictive Analytics AI/ML
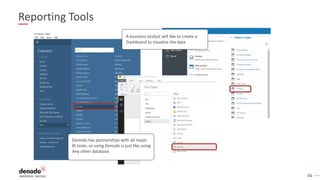
- 31. 34 Reporting Tools A business analyst will like to create a Dashboard to visualize the data Denodo has partnerships with all major BI tools, so using Denodo is just like using Any other database
- 32. 41 Sources 2. Combine Combine, Transform & Semantics 3. Consume 1. Connect Consuming Applications 4.Dev/Ops
- 33. 42 Key Takeaways ü Information architectures are getting more complex, more diverse, and more distributed. ü Traditional technologies and data replication don’t cut it anymore. ü Data virtualization makes it quick and easy to expose data from multiple source to your users. ü Data virtualization provides a governance and management infrastructure required for successful data management.
- 34. Q&A
- 35. Next Steps
- 37. Next session | 19 November Accelerate Migration to the Cloud using Data Virtualization Chris Day Director, APAC Sales Engineering, Denodo Sushant Kumar Product Marketing Manager, Denodo REGISTER NOW bit.ly/3lREw6J
- 38. VIRTUAL November 24-25, 2020 | 9:00am SGT | 12:00pm AEDT The Agile Data Management and Analytics Conference Advancing Cloud, Analytics & Data Science with Logical Data Fabric REGISTER NOW bit.ly/2FK5pdA
- 39. Thanks! www.denodo.com info@denodo.com © Copyright Denodo Technologies. All rights reserved Unless otherwise specified, no part of this PDF file may be reproduced or utilized in any for or by any means, electronic or mechanical, including photocopying and microfilm, without prior the written authorization from Denodo Technologies.