Location via proxy:   [ UP ]  
[Report a bug]   [Manage cookies]                
SlideShare a Scribd company logo
Business Responsibility and Sustainability Reporting (BRSR)
Copyright © 2020-2021 by Sattva Media and Consulting Private Ltd.
Executive Summary
The Goal
The BRSR report is mandated for the top 1,000 listed companies in FY22-23, and voluntary for others from FY21-22. The SEBI recommended
report is the first step towards standardisation of sustainability disclosures in India and is expected to get more stringent in the years to come. India
is committed to reduce its emissions as conveyed in COP26 last year, and with corporates announcing their respective commitments, their
sustainability initiatives and therefore the disclosures will play an important role in the coming days.
The Need
The individual sustainability reports released by various organisations provide choices to the agency to declare selective indicators based on
their comfort, choice and intent, but with BRSR report, the indicators are detailed and mostly mandated. Therefore the organisations are
expected to set the right processes and systems across functions, so as to gather, compile and report on the relevant indicators from the next FY
onwards.
In our sample study, we have found some of the best performing organisations, even if they have comprehensive disclosures, lack data on some
parameters across sections in the new BRSR template. For the organisations that do not fall directly into this criteria, it may be a good practice to
prioritise the key metrics based on BRSR that are relevant and useful to measure their sustainability journey.
The Benefit
Initiating the BRSR reporting for organisations that are mandated and the ones that are not, will have the following benefit –
 The exercise provides an opportunity to check for one’s readiness on critical indicators regulators may be looking to evaluate
 Provide a standardised format to assess one’s performance across peers, industries or even complementing sectors
 BRSR can be the first step towards sustainability reporting for organisations, that have so far not plunged into it
 Publishing BRSR also requires the organisations to establish or streamline internal systems and processes, and build capability of the staff
that can set the path forfuture
 As a mid-to-long term outcome, corporates can look to lower cost of capital, improved stock performance & valuations, efficient operational
practices and overall reputationgains
4
Background & Objective
Background
The top 1,000 listed companies in India were required to furnish initiatives taken by them from an Environmental, Social and Governance (ESG)
perspective, in the format as specified by the Securities and Exchange Board of India (SEBI) in Business Responsibility Report (BRR). The
report was shared with the stock exchanges as a part of their annual reports until FY21-22.
Keeping in line with the global evolution of ESG-related reporting, SEBI, through a notification dated 5 May 2021, mandated companies to use a
new reporting template based on ESG parameters, called Business Responsibility and Sustainability Report (BRSR). The report notes the
following
 Top 1,000 listed companies by market capitalisation, to mandatorily report in BRSR format for FY22-23
 For FY2021-22, voluntary disclosure by the top 1,000 listed companies by market capitalisation in BRSR format
 For listed companies beyond top 1000, have an option to submit BRSR in place of BRR effective FY2021-22 onwards
Additionally, SEBI through a notification dated 10 May 2021 has prescribed the format of the BRSR report, along with a guidance note to enable
companies to interpret the scope of disclosures required to be made in the report. There are mandatory and optional sections in the BRSR report
with 2 versions available to be used for smaller unlisted companies and established entities – BRSR Lite and BRSR comprehensive.
6
Copyright © 2020-2021 by Sattva Media and Consulting Private Ltd.
1980 1999 2000 2006 2007
The Human The Triple BottomLine
TBL suggested
business should be
concerned about impact
on people & planet –
and not only financeand
profit
Global Reporting Initiative (PRI) Principles for
Responsible Investment
World's leading proponent
of responsible investment,
promoting to incorporate
ESG into investment
decision making
Climate Disclosure
Standards Board (CDSB)
A non-profit org. providing
material information for
investors & financial markets
through integration ofclimate
related information into
mainstream financial reporting
Development (GRI)
Index Non-Govt. org. thatlaunched
UNDP releases HDI 1st version of guidelines,was
socio-economic inaugurated as a UNEP
indicators to monitor collaborating organization in
developmentof
Nations
2002
Strengthening sustainable business practices & disclosures, is driven globally by
regulators, investors, consumers, staff and other stakeholders
2011 2013
Integrated Reporting (IR)
A concise communication
on how an organization's
strategy, governance,
performance and prospects
lead to value creation over
the short, medium andlong
term
2015 2021
Sustainability Accounting
Standards Board (SASB)
A non-profit org. Foundedto
establish industry specific
disclosure standards across
ESG topics that facilitate
communication between
companies and investors
Task Force on Climate
Related Financial
Disclosures (TCFD)
Focuses on reporting the
impact of an organisation
on global climate. Itseeks
to make disclosuresmore
consistent & comparable
Value Reporting Framework(VRF)
SASB merged with integrated
Reporting framework to form VRF
which is industry agnostic. By June
‘22, VRF will consolidate with CDSB
to form the International
Sustainability Standards Board
(ISSB)
*Illustrative 7
Copyright © 2020-2021 by Sattva Media and Consulting Private Ltd.
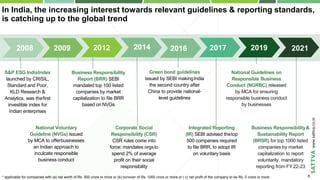
S&P ESG IndiaIndex
launched by CRISIL,
Standard and Poor,
KLD Research &
Analytics, was thefirst
investible index for
Indian enterprises
National Voluntary
Guideline (NVGs) issued
by MCA to offerbusinesses
an Indian approach to
inculcate responsible
business conduct
Business Responsibility
Report (BRR) SEBI
mandated top 100 listed
companies by market
capitalization to file BRR
based on NVGs
Integrated Reporting
(IR) SEBI advised thetop
500 companies required
to file BRR, to adopt IR
on voluntary basis
National Guidelines on
Responsible Business
Conduct (NGRBC) released
by MCA for ensuring
responsible business conduct
by businesses
Business Responsibility&
Sustainability Report
(BRSR) for top 1000 listed
companies by market
capitalization to report
voluntarily, mandatory
reporting from FY22-23
2008 2009 2012 2014 2017 2019 2021
* applicable for companies with (a) net worth of Rs. 500 crore or more or (b) turnover of Rs. 1000 crore or more or ( c) net profit of the company to be Rs. 5 crore or more
In India, the increasing interest towards relevant guidelines & reporting standards,
is catching up to the global trend
Corporate Social
Responsibility (CSR)
CSR rules come into
force; mandates orgsto
spend 2% of average
profit on their social
responsibility
2016
Green bond guidelines
issued by SEBI makingIndia
the second country after
China to provide national-
level guidelines
8
Copyright © 2020-2021 by Sattva Media and Consulting Private Ltd.
Over the past decade, companies publishing sustainability reports to communicate
commitment has continued to grow, and with BRSR, this trend will further increase
Key Facts and Insights Risk & Opportunities forbusiness7
Sustainability reporting trendsglobally
Sustainability reporting trends inIndia
of S&P 500 companies published sustainability reports in
2020 globally in comparison to 20% in 20111
.
Source: 1. Link1 Link2 Link3 Link4 Link5 Link6Link7
92%
80%
68%
of top 100 companies byrevenue worldwide now report on
sustainability5.
of sustainability reports mentioned COVID-19 or impact of the
pandemic in their sustainability report.
of executives confirm the operational impacts of climate-
related disasters on business, with more than a quarter facing
a scarcity of resources due to climatechange4
.
27%
of MSCI India3 constituents publishing sustainabilityreports2
.
97%
disclosure rate on employee diversity and opportunitypolicies
95%
Indian companies have committed to reducing emissions so
far, according to the Science Based Targets initiative (SBTi),
a global alliance that helps firms set climategoals6
.
62
 Indian companies stand to lose Rs 7.14 lakh Cr to the
impact of climate change if they do not take mitigation
measures over the next five years, according to the
Carbon Disclosure Project’s (CDP) 2020 annualreport.
 2/3 multinationals plan to tackle their supply chains’
emissions, a Standard Chartered study of 400 MNCs in
June’21 showed. So to continue supplying to global
counterparts, Indian companies have to invest into
sustainable practices, else they run a risk of losing $274
billion in exports everyyear.
 Capital markets are starting to reward companiesmaking
systematic investments in climate change and
sustainability efforts by pushing their stock priceshigher.
 Investors are increasingly using non-financial disclosures
to make investment decisions, which in turn is the reason
many companies have moved towards integratedfinancial
reports.
9
Copyright © 2020-2021 by Sattva Media and Consulting Private Ltd.
BRSR builds on from BRR reporting to encourage further accountability,
transparency and standardization within corporations
Attributes Business Responsibility Reporting (BRR) Business Responsibility & Sustainability Reporting
(BRSR)
Launch year 2012 2021
Applicability
criteria
Applicable to top 100 listed companies by market
capitalization in 2012, to 1000 companies in 2019
Voluntary applicability of BRSR on the top 1000 listed
entities by market capitalization for FY 2021-22, and
mandatorily be obliged to such reporting from FY2022-23
Underlying
guideline
National Voluntary Guidelines(NVGs) introduced in 2011 9 principles of National Guidelines on ResponsibleBusiness
Conduct (NGRBC) revised in 2019
Primary
Reporting
Values
Integrity & ethics Accountability, greater transparency, cross reporting &
interlinkage with other reporting standards, betterdefined
performance metrics, uniformity and comparability across
industries
Reporting
mechanism
Reporting as a part of annualreports Reporting as a part of annual reports and file to Ministry of
Corporate Affairs (MCA)
Core
Principles
Ethics & transparency | Safety | Employee well-being |
Stakeholder management | Human rights | Environmental
preservation | Public & regulatory policy | Inclusive growth |
Customer centric service
The 9 principles of NGRBC have been detailed further and
mapped to performance indicators that may be mandatory
or voluntary (Leadership). The details requested in BRSR
warrants leadership accountability, consistency in reporting
& ownership of businessimpact.
11
Copyright © 2020-2021 by Sattva Media and Consulting Private Ltd.
BRSR demands organisations to report in fair amount of detail, however it may
have some chances of disparity in quality, depth and uniformity of information
Disclosure questions related to:
● Details of the listed entity, products/
services, operations
● Markets served, employees,
representation of women, turnover
rate for permanent employees
● Holdings, subsidiaries & associate
companies
● CSR details, transparency &
disclosures compliances
Disclosure questions related to:
● Policy & management
processes
● Governance, leadership &
oversight
Essential indicators (Mandatory):
● Data on awareness programs
conducted
● Environmental data on
energy, emissions, waste,
water etc.
Leadership indicators (Voluntary):
● Data on life cycle
assessments (LCAs), conflict
management policy, breakup
of energy policy etc.
SECTION A
General Disclosures
SECTION B
Management &
Process Disclosures
SECTION C
Principle wise
Performance
Disclosures
12
Copyright © 2020-2021 by Sattva Media and Consulting Private Ltd.
SEBI has suggested 2 options for BRSR reporting: one for organisations that
have matured and the ones who are embarking the journey
BRS R Li t e BRS R Co m p r e h e n s i v e
The lite version of the report allows smaller unlisted companies
below a certain threshold (currently undefined by SEBI) to adopt
a lite version of the BRSR format on a voluntary basis to make it
easier for such companies to report on sustainability-related
matters
Leadership indicators (under Section C) are not mandatory
under the lite version of BRSR
The underlying principle behind the Lite version is that the
implementation of reporting requirements should be done in a
phased manner, such that smaller companies get ample timeto
adapt and learn from the largerones
The reporting of the comprehensive version of BRSR is
mandated by SEBI, from FY 22-23, for the top 1000 listed
companies in India by marketcapitalization
Essential and leadership indicators (under Section C)are
mandatory under the comprehensive version ofBRSR
The BRSR framework is expected to meet global reporting
standards that lay emphasis on ESG related disclosures and
enhance contribution towards sustainable growth and
development. It is an effective compliance andcommunication
tool for a company's non-financialdisclosures
The scoring mechanism of BRSR comprises total 300 scores (225 scores under Section A, B, and C- Essential Indicators and 75 scores
under Section C- LeadershipIndicators) 13
Copyright © 2020-2021 by Sattva Media and Consulting Private Ltd.
 Top 20 companies were selected across manufacturing and services industry based on
market capitalization
 The hypothesis provides us an opportunity to identify large organisations, top in the list and
the ones beyond the top ranked, along with mid to small sized organisations that have areas
of improvement across ESGparameters
 Though reporting levels against theBRSR framework has improved marginally across
years, overall disclosure levels were observed to be far from the required levels
 The disclosure patterns are consistent across industries, with firms reporting better on
Section A: General Information
 Data availability is lowest for Section C: the nine Principles
 Amongst the principles, data availability is highest across industries for Principles 4
(marginally stakeholders) and 7 (regulatory policy) and lowest for Principles 2(sustainable
goods and services), 3 (employee well-being), and 8 (inclusive growth)
 Data was sourced against the 198 BRSR attributes through company reports, such as
Annual reports, Sustainability / ESG / BRSRreports
 Data was analyzed across three financial years - FY19 to FY21
 The analysis included reporting on ‘availability’ of data across the required attributes
Industry selection
Data insights
Data collection
1
2
3
Element Details
Overview of the research study
15
Copyright © 2020-2021 by Sattva Media and Consulting Private Ltd.
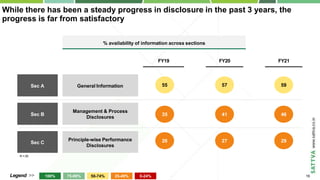
While there has been a steady progress in disclosure in the past 3 years, the
progress is far from satisfactory
Sec A General Information
Sec B
Management & Process
Disclosures
Sec C
Principle-wise Performance
Disclosures
FY19 FY20 FY21
55 57 59
35 41 46
26 27 29
% availability of information across sections
100% 75-99% 50-74% 25-49% 0-24%
Legend >>
N =20
16
Copyright © 2020-2021 by Sattva Media and Consulting Private Ltd.
General information is reported better in comparison to other sections; however,
the pattern across sections is consistent across industries
Sec A 65% 58% 54% 57%
48% 43% 46% 50%
29% 32% 26% 28%
General Information
Sec B
Management & Process
Disclosures
Sec C
Principle-wise Performance
Disclosures
BFSI IT Textile Chemical
% availability of information across sections(FY21)
100% 75-99% 50-74% 25-49% 0-24%
Legend >>
N =20
17
Copyright © 2020-2021 by Sattva Media and Consulting Private Ltd.
Highest disclosures around marginalised stakeholders and regulatory policy,
while lowest reporting is on inclusive growth and sustainable goods / services
Overall (%)
Pr. 8 19% 13% 3% 14%
Inclusive Growth
BFSI IT Textile Chemicals
Pr. 4 Marginalised Stakeholders 100% 100% 100% 100% 100%
Pr. 7 Regulatory Policy 100% 100% 100% 100% 100%
Pr. 9 Consumer Engagement 38% 39% 46% 32% 33%
Pr. 6 Environment Restoration 31% 36% 47% 30% 35%
13%
100% 75-99% 50-74% 25-49% 0-24%
Legend >>
Pr. 1
Transparent & Accountable
Business
28% 28% 31% 25% 26%
Pr. 5 Human Rights
27% 27% 24% 29% 28%
Pr. 3 Employee Well-being 23% 23% 27% 17% 25%
Pr. 2 Sustainable Goods and Services 22% 21% 22% 25% 23%
N =20
18
Copyright © 2020-2021 by Sattva Media and Consulting Private Ltd.
• Majority of the companies (90%) reported on sustainable sourcing, however, only 20% reported on % inputs sourced
sustainably
• Reporting on usage of recycled input material in production is low (10%) across sectors
• Reporting on applicability of Extended Producer Responsibility is low (25%) across sectors
• Majority of the companies (75%) reported on environmental / social aspects of products and services
• 8 companies reported capital investment on energy conservationequipment
• Only 1 company(HDFC) - reported on % R&D / capex investment for improving environment / social aspect of products
• 50% of the companies reported on complaints received against directors whereas 9 out of 20 companies reported having
a process in place tomanage such conflicts
• All companies have reported details of penalties / fines levied by regulatory authorities, however, reporting on corruption
complaints is low acrosssectors
• Majority of the companies (80%) reported on all attributes pertaining to training details for permanent employees
• 100% of the IT companies have reported on all the training attributes
• Reporting on trainings for BoD / leadership and contractual workers is low
Business Readiness across 9 Principles (1/4)
Training
Penalties&
Corruption
Conflicts of
Interest
PRINCIPLE
1
Reporting
on Sust
Goods /
Services
PRINCIPLE
2
Sourcing /
EPR
19
Copyright © 2020-2021 by Sattva Media and Consulting Private Ltd.
• Details on engagement with marginalised stakeholders is well reported (100%) across allsectors
Business Readiness across 9 Principles (2/4)
Marginalised
Stakeholders
PRINCIPLE
4
PRINCIPLE
3
Employee
Benefits
• Majority of the (75%) companies reported on insurances and employee benefits for permanent employees, however
reporting for BoD, leadership and workers on the same was low
• Health insurance was highest reported across sectors, followed byparental benefits
Training
• Majority of the companies (80%) have reported on training details of permanent employees, however reporting of gender
segregated data is low
• IT and textile industries have the best reporting (100%)
Hazard
• Reporting on occupational health and safety management system attributes and identifying work related hazards islow
across sectors
• Chemicals firms report better than the rest, on this set of information
Safety
• Overall, reporting on safety related incidents is low; manufacturing firms (especially chemicals companies) have better
reporting than other sectors
• Only 5 companies (majority Chemical) reported on assessment of value chain partners
Retenti
andRevi
on
ew
• Reporting on information pertaining to employee retention and career development reviews is low; incidentally more firms
have reported gender segregated numbers as opposed to overalllevels
Employee
Unions
• Majority of the companies (95%) have reported details on employee unions, however only 55% have reported gender
segregated numbers
20
Copyright © 2020-2021 by Sattva Media and Consulting Private Ltd.
NCIPLE
5
Complaints
• 12 out of 20 (60%) firms have reported on human rights training provided to permanent employees. However,
details on training to contractual employees / workers is not well reported
• All companies have reported on POSH complaints, followed by child labor and discrimination at workplace
• Manufacturing firms have better reporting on employee complaints than other sectors
PRI
Remuneration
• Majority of the firms (95%) reported on remuneration details for BoDs and leadership, however remunerations
details for employees are not well reported(30%)
Environment
Energy
Emissions
• Majority of the firms (70%) have reported on scope 1 / scope 2 emissions across sectors. However, only 9 companies
reported on emission intensity and even less (4) reported on details pertaining to specific emissions like NOx, SOx etc.
Water
PRINCIPLE
6
• Energy / emissions attributes are better reported across all sectors, as compared to water and waste attributes
• An exception to this is the Textile sector that reported better (50%) on water data
• Of the 14 (70%) firms reporting total energy consumption, 12 have reported on consumption from all energy sources
• Only 30% companies have reported energyintensity
• Only 50% companies reported total water consumption, and even less (~30%) reported consumption from all sources.
• Reporting on water intensity is low (15%) across allsectors
• While 25% companies reported details on zero liquid discharge mechanism, only ~15% reported coverage
• Only manufacturing companies have reported thisdata
Business Readiness across 9 Principles (3/4)
21
Copyright © 2020-2021 by Sattva Media and Consulting Private Ltd.
Business Readiness across 9 Principles (4/4)
• 50% (10) of the companies reported on waste management details for any type of waste, whereas only 3 companies
reported on all wastegenerated
• Overall reporting on e-waste (30%) is higher than other categories - better reporting by services firms on this category
• IT sector has the highest reported details on waste management
Waste
PRINCIPLE
6
PRINCIPLE
7
Industry
Associations
• All companies have reported on industry associationsmembership
PRINCIPLE
8
Sourcing
• While 60% of the companies reported on sourcing locally, only 5 reported actual percentage of inputs sourced
• Reporting on sourcing from MSME / small producers is low (20%)
• While 45% of the companies reported on having a preferential procurement policy, only a few (~5%) reported on the
marginalised communities they source from, and percentage of inputssourced
PRINCIPLE
9
Consumer
Complaints
• All companies have reported having a mechanism in place to receive and redress consumer complaints and feedback
• Complaints on advertising and unfair trade practices (75% for both) are the highest reported across all sectors
• BFSI companies reported better (50%) on data privacycomplaints
Cyber
Security
• 60% of the companies reported having a framework / policy on cyber security and risks related to data privacy
• Majority of the IT (100%) and BFSI (83%) companies reported this data
Product
Information
• All companies reported providing information on products / services through various channels / platforms / links
• Majority of the companies (85%) reported on having taken steps to inform consumers on safe product usage
• All chemical companies reported this data
22
Copyright © 2020-2021 by Sattva Media and Consulting Private Ltd.
BRSR Report and other reporting standards
4
Copyright © 2020-2021 by Sattva Media and Consulting Private Ltd.
Going forward, BRSR may serve as the single comprehensive source of non-
financial sustainability information relevant to all business stakeholders1
Note: 1.Investors, shareholders, regulators, and public at large 2. Frameworks such as Global Reporting Initiative (GRI), Sustainability Accounting Standards Board
(SASB), Task Force on Climate-Related Financial Disclosures (TCFD), Integrated Reporting (<IR>)
 As per SEBI, the BRSR guidance note suggests listed companies which prepare and disclose sustainability reports (as part of annual
report) based on internationally accepted reporting frameworks2 can cross-reference the disclosures made under such frameworks to the
disclosures sought under the BRSR.
 In case the data sought in the reporting format is already disclosed in the annual report, the listed entity can provide a cross-reference to the
same.
 In addition, the organisation may disclose any other relevant sustainability related information at appropriate places in the BRSR report as
deemed fit.
 The BRSR seeks disclosure of the reporting boundary i.e. whether the reporting is done for the entity on a stand-alone or consolidated
basis. Listed entities shall ensure consistency in reporting boundary across the report.
 In case disclosures are not applicable, reasons for the same is expected by MCA
24
Copyright © 2020-2021 by Sattva Media and Consulting Private Ltd.
UN SDGs are the backbone of the Principles of NGRBC; each of the 9 Principles
forms the very base of BRSR reporting
Integrity, transparency, &
accountability
Sustainable provision of
goods & services
Employee well-being
Respecting interests of
stakeholders
Promotion of human
rights
Protection of the
environment
Transparent policies &
engagement with public
Inclusive growth &
equitable development
1
2
3
4
5
6
7
8
9 Responsible value
provision to consumers
25
Copyright © 2020-2021 by Sattva Media and Consulting Private Ltd.
Snapshot of other international frameworks that can be cross referenced to
BRSR during reporting
Name Inception Purpose Information Disclosed Best Suited For Audience
E S G
Global
Reporting
Initiative
(GRI)
1997  Helps organisations
report on economic,
social and environmental
impact considering
various range ofinterests
 General disclosures
(governance,stakeholder
engagement & reporting
practices)
 Economic impact
 Environmental impact
 Social impact
 Companies of anysize,
sector or location
 Wide rangeof
stakeholders
E G
Carbon
Disclosure
Project(CDP)
2002  Captures environmental
performance and data
related to GHGemissions
 Climate changeimpacts
 Waterimpacts
 Forestimpacts
 Supply chain
 Publicly listed
companies &suppliers
looking to manage,
disclose carbon
footprints
 Investor
 Procurement
 Policymakers
E S G
International
Integrated
Reporting
Council (IR)
2010  Establishing guiding
principles and content,
allowing companies to
produce integrated
report
 Environmental impacts
 Social capital
 Human capital
 Business model resilience &
innovation
 Physical climate change
impacts
 Leadership & governance
 Framework guidance
for how information is
presented on topics:
 Global
 Industry-agnostic
 Principles-based
 High-level elements
 Drives connectivity
of information
 Investors
 Lenders
26
Copyright © 2020-2021 by Sattva Media and Consulting Private Ltd.
Few more of the International reporting frameworks
Name Inception Purpose Information Disclosed Best Suited For Audience
E S G
Sustainability
Accounting
Standards
Board(SASB)
2012  Facilitates disclosure
of material
sustainability
information in SEC
filing in US
 Environmental impacts
 Social capital
 Human capital
 Business model resilience
and innovation
 Physical climate change
impacts
 Leadership and governance
 Standard requirementsfor
reporting by topic and
industry:
 United States only
 Industry specific
 Metrics-based
 Disclosure topics and
metrics enables
compatibility of info
 Financial
Stakeholde
rs
E G
Task Forceon
Climate
related
Financial
Disclosures
(TCFD)
2017  Encourages firms to
align climate related
risks disclosures with
investors needs
 Governance
 Strategy planning including
climate change
 Risk management
 Companies seeking toplan
for and mitigate climate-
related risks
 Wide
range of
Stakeholde
rs
E S G
International
Sustainability
Standards
Board (ISSB)
2021  Drive a
comprehensive
baseline with info on
sustainability related
risks andopportunities
 Technical Readiness
Working Groups(TRWG)
 Climate specific and
general requirements
prototype sets
 Identification, measurement,
and disclosure of climate
related financial information
 Investors,
capital
market
participant
s
27
Copyright © 2020-2021 by Sattva Media and Consulting Private Ltd.
5 Benefit for Companies
Copyright © 2020-2021 by Sattva Media and Consulting Private Ltd.
Business case matrix maps the BRSR principles to its attribution of value
creation for business
BRSR Principles
Revenue growth
and market access
Cost savings
and productivity
Access to
capital
Risk management/
license to operate
Human
capital
Brand value/
reputation
Integrity, ethics,
transparency, accountability
Safe and sustainablegoods
and services
Well-being of organisations
employees
Respect and responsiveness
to all stakeholders
Respect and promote
human rights
Respect, protect and restore
the environment
Responsible and
transparent policy advocacy
Promote inclusive growth
and equitable development
Provide value to consumer
responsibly
Direct Indirect
IMPACT: None 29
Copyright © 2020-2021 by Sattva Media and Consulting Private Ltd.
• Better operational
efficiency and Cost
savings
• Manage climate related
risks that significantly
impact their operations,
revenue, or expenditures
The Business
Case Matrix
Benefits
Financial
gain
Operational
gain
Reputational
gain
perception
• Improve brand value &
• Fostering innovation and
thought leadership
• Attract talent
• Counter Investor Activism
• Reduced regulatory and
legal interventions
● Better valuations and stock performance
● Increased access to cheaper equity and
debt capital
● Access to markets which require ESG
compliance
BRSR aims at not mere reporting, but the implementation of the NGRBC principles,
thereby effectively addressing the ESG related challenges
30
Copyright © 2020-2021 by Sattva Media and Consulting Private Ltd.
While companies have increased their thrust on ESG, a direct co-relation of
valuation to ESG-related factors is emerging over time
 74% of the institutional investors now more likely to “divest”
based on poor environmental, social and governance
(ESG) performance, than before the COVID-19pandemic.
 Vast majority (90%) say they now pay more attention to
companies’ ESG performance when making investment
decisions, but admit they’ve been slow to take concrete
action.
 Global sustainable assets have grown at 12%CAGR
between 2016 & 2020.
 Indian AUM (assets under management) of ESG have
risen 370% from INR 2,630 Cr in 2019 to 12,300 Cr in
2021.
Source: 2021 EY Global Institutional investor survey | PRI
FINANCIAL
OPERATIONAL
REPUTATIONAL
48
0 39
6
66
3 54
5
77
1 64
4
US UK
53 73 97 3 8 12 1 1 3
BRAZIL INDIA VIETNAM
PRI’ssignatories are
assetowners and
investmentmanagers
who havecommitted
to integrate ESG
factors intoinvestment
decisions
Pre-Pandemic Post-Pandemic
December2019 June2021
In the last six months, the number of signatories to Principles for
Responsible Investment (PRI) increased by around 35%
As per PRI, Ambit Capital Research
31
Copyright © 2020-2021 by Sattva Media and Consulting Private Ltd.
As per the MSCI metrices, ESG leaders command higher valuations and mostly
perform better than rest of the organisations
MSCI ACWI MSCI INDIA
ESG Leaders Overall ESG Leaders Overall
CAGR % (as on Nov 30, 2021)
FINANCIAL
OPERATIONAL
REPUTATIONAL
1 Year 21.31 19.78 28.07 34.09
3 Year 17.45 16.53 16.77 14.74
5 Year 15.07 14.57 16.61 14.22
10 Year 12.34 11.98 12.30 9.77
Valuations
P/E Forward 19.18 17.76 25.05 21.72
P/BV – Price /bookvalue 3.48 3.00 3.79 3.65
Source: MSCI data ACWI(All Country World Index) 32
Copyright © 2020-2021 by Sattva Media and Consulting Private Ltd.
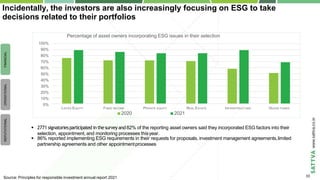
Incidentally, the investors are also increasingly focusing on ESG to take
decisions related to their portfolios
LISTED EQUITY REAL ESTATE INFRASTRUCTURE HEDGE FUNDS
Percentage of asset owners incorporating ESG issues in their selection
100%
90%
80%
70%
60%
50%
40%
30%
20%
10%
0%
FIXED INCOME PRIVATE EQUITY
2020 2021
FINANCIAL
OPERATIONAL
REPUTATIONAL
Source: Principles for responsible investment annual report 2021
 2771 signatoriesparticipated inthesurveyand82% of the reporting asset owners said they incorporated ESG factors into their
selection, appointment, and monitoring processes thisyear.
 86% reported implementing ESG requirements in their requests for proposals, investment management agreements,limited
partnership agreements and other appointmentprocesses
33
Copyright © 2020-2021 by Sattva Media and Consulting Private Ltd.
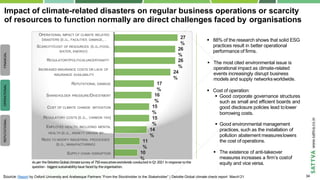
Impact of climate-related disasters on regular business operations or scarcity
of resources to function normally are direct challenges faced by organisations
 88% of the research shows that solid ESG
practices result in better operational
performance of firms.
 The most cited environmental issue is
operational impact as climate-related
events increasingly disrupt business
models and supply networksworldwide.
 Cost of operation:
 Good corporate governance structures
such as small and efficient boards and
good disclosure policies lead tolower
borrowing costs.
 Good environmental management
practices, such as the installation of
pollution abatement measureslowers
the cost of operations.
 The existence of anti-takeover
measures increases a firm’s costof
equity and vice versa.
Source: Report by Oxford University and Arabesque Partners “From the Stockholder to the Stakeholder” | Deloitte Global climate check report March’21
FINANCIAL
OPERATIONAL
REPUTATIONAL
As per theDeloitteGlobalclimatesurvey of 750 executivesworldwide conducted in Q1 2021 In response to the
question - biggestsustainabilityissue faced by theorganisation.
10
%
11
%
14
%
15
%
15
%
16
%
17
%
24
%
26
%
26
%
27
%
OPERATIONAL IMPACT OF CLIMATE RELATED
DISASTERS (E.G., FACILITIES DAMAGE,…
SCARCITY/COST OF RESOURCES (E.G.,FOOD,
WATER, ENERGY)
REGULATORY/POLITICALUNCERTAINITY
INCREASED INSURANCE COSTS OR LACK OF
INSURANCE AVAILABILITY
REPUTATIONAL DAMAGE
SHAREHOLDER PRESSURE/DIVESTMENT
COST OF CLIMATE CHANGE MITIGATION
REGULATORY COSTS (E.G., CARBON TAX)
EMPLOYEE HEALTH, INCLUDING MENTAL
HEALTH (E.G., ANXIETY DRIVEN BY…
NEED TO MODIFY INDUSTRIAL PROCESSES
(E.G., MANUFACTURING)
SUPPLY CHAIN DISRUPTION
34
Copyright © 2020-2021 by Sattva Media and Consulting Private Ltd.
Integrating reputational risk assessment regularly, as part of the company’s
overall governance and culture, will continue to prioritize key ESG challenges
 Some potential risk triggers identified duringthe
survey were –
 Social issues like lack of diversity, equality,
and inclusion; labour relations; orcommunity
impact
 Governance risks like compliance failuresor
activist investors
 Environmental risks like greenhouse gas
emissions or waste management impacting
the reputation
Source: Bloomberg Law ESG Survey 2021
FINANCIAL
OPERATIONAL
REPUTATIONAL
80
70
60
50
40
30
20
10
0
Company Attracting Compliance U.S. Investor ESG scores EU
reputation investment with industry regulatory activists and ranking regulatory
standard changes requirements
Drivers of decisions to prepare ESG disclosures in 2021
35
Copyright © 2020-2021 by Sattva Media and Consulting Private Ltd.
Americas
European Union
As of 2021, at least 30 countries around the world have or have plans in place to institute ESG related reporting, with countries such as France,
Australia and Canada being some of the early proponents of ESG reporting in 2001, 2003 & 2004 respectively.
Studies at the Swiss Investment institute have supported the argument that:
● Mandatory ESG disclosure increased the accuracy of analysts’ earnings forecasts and lowers analyst forecast dispersion
● ESG’s ability to reduce negative ESG incidents, leads to regulatory changes, and eventually translate into a reduced likelihood of stock
price crashes. Eg: BP oil spill in the Gulf of Mexico in 2010 significantly affected market prices
● Effects are strongest if the mandatory disclosure is introduced all at once for E, S, and G and if the relevant authority is a government
instead of a national stockexchange
 New ESG Regulation Out of Europe Redefines Investment Risk -
The EU’s Sustainable Finance Disclosure Regulation (SFDR),
which came into effect in March’21, is designed to drive capital
toward sustainably-oriented investments.
 Under the SFDR, all EU asset managers are asked topublicly
disclose their approach to incorporating sustainability
considerations in their investmentdecisions
The global reforms on ESG that may directly or indirectly influence Indian
multinationals and other organisations in the value chain in the future
 On June 16, 2021, the U.S. House of Representativespassed
legislation that would impose new ESG due diligence and
disclosure requirements on publicly tradedcompanies.
 They mandated that public companies listed with the U.S.
Securities and Exchange Commission (SEC) disclose at their
shareholder meetings the link between ESG metrics and thelong-
term business strategy" of the company; and "a description of any
process" the company uses to "determine the impact of ESG
metrics on the long-term business strategy" of the company.
37
ESG &
MYTHS VS
REALITY
brsr.pptx
brsr.pptx
brsr.pptx
brsr.pptx
Scenario 1 GOOD
prevails
brsr.pptx
brsr.pptx
brsr.pptx
brsr.pptx

More Related Content

brsr.pptx

  • 1. Business Responsibility and Sustainability Reporting (BRSR)
  • 2. Copyright © 2020-2021 by Sattva Media and Consulting Private Ltd. Executive Summary The Goal The BRSR report is mandated for the top 1,000 listed companies in FY22-23, and voluntary for others from FY21-22. The SEBI recommended report is the first step towards standardisation of sustainability disclosures in India and is expected to get more stringent in the years to come. India is committed to reduce its emissions as conveyed in COP26 last year, and with corporates announcing their respective commitments, their sustainability initiatives and therefore the disclosures will play an important role in the coming days. The Need The individual sustainability reports released by various organisations provide choices to the agency to declare selective indicators based on their comfort, choice and intent, but with BRSR report, the indicators are detailed and mostly mandated. Therefore the organisations are expected to set the right processes and systems across functions, so as to gather, compile and report on the relevant indicators from the next FY onwards. In our sample study, we have found some of the best performing organisations, even if they have comprehensive disclosures, lack data on some parameters across sections in the new BRSR template. For the organisations that do not fall directly into this criteria, it may be a good practice to prioritise the key metrics based on BRSR that are relevant and useful to measure their sustainability journey. The Benefit Initiating the BRSR reporting for organisations that are mandated and the ones that are not, will have the following benefit –  The exercise provides an opportunity to check for one’s readiness on critical indicators regulators may be looking to evaluate  Provide a standardised format to assess one’s performance across peers, industries or even complementing sectors  BRSR can be the first step towards sustainability reporting for organisations, that have so far not plunged into it  Publishing BRSR also requires the organisations to establish or streamline internal systems and processes, and build capability of the staff that can set the path forfuture  As a mid-to-long term outcome, corporates can look to lower cost of capital, improved stock performance & valuations, efficient operational practices and overall reputationgains 4
  • 3. Background & Objective Background The top 1,000 listed companies in India were required to furnish initiatives taken by them from an Environmental, Social and Governance (ESG) perspective, in the format as specified by the Securities and Exchange Board of India (SEBI) in Business Responsibility Report (BRR). The report was shared with the stock exchanges as a part of their annual reports until FY21-22. Keeping in line with the global evolution of ESG-related reporting, SEBI, through a notification dated 5 May 2021, mandated companies to use a new reporting template based on ESG parameters, called Business Responsibility and Sustainability Report (BRSR). The report notes the following  Top 1,000 listed companies by market capitalisation, to mandatorily report in BRSR format for FY22-23  For FY2021-22, voluntary disclosure by the top 1,000 listed companies by market capitalisation in BRSR format  For listed companies beyond top 1000, have an option to submit BRSR in place of BRR effective FY2021-22 onwards Additionally, SEBI through a notification dated 10 May 2021 has prescribed the format of the BRSR report, along with a guidance note to enable companies to interpret the scope of disclosures required to be made in the report. There are mandatory and optional sections in the BRSR report with 2 versions available to be used for smaller unlisted companies and established entities – BRSR Lite and BRSR comprehensive. 6
  • 4. Copyright © 2020-2021 by Sattva Media and Consulting Private Ltd. 1980 1999 2000 2006 2007 The Human The Triple BottomLine TBL suggested business should be concerned about impact on people & planet – and not only financeand profit Global Reporting Initiative (PRI) Principles for Responsible Investment World's leading proponent of responsible investment, promoting to incorporate ESG into investment decision making Climate Disclosure Standards Board (CDSB) A non-profit org. providing material information for investors & financial markets through integration ofclimate related information into mainstream financial reporting Development (GRI) Index Non-Govt. org. thatlaunched UNDP releases HDI 1st version of guidelines,was socio-economic inaugurated as a UNEP indicators to monitor collaborating organization in developmentof Nations 2002 Strengthening sustainable business practices & disclosures, is driven globally by regulators, investors, consumers, staff and other stakeholders 2011 2013 Integrated Reporting (IR) A concise communication on how an organization's strategy, governance, performance and prospects lead to value creation over the short, medium andlong term 2015 2021 Sustainability Accounting Standards Board (SASB) A non-profit org. Foundedto establish industry specific disclosure standards across ESG topics that facilitate communication between companies and investors Task Force on Climate Related Financial Disclosures (TCFD) Focuses on reporting the impact of an organisation on global climate. Itseeks to make disclosuresmore consistent & comparable Value Reporting Framework(VRF) SASB merged with integrated Reporting framework to form VRF which is industry agnostic. By June ‘22, VRF will consolidate with CDSB to form the International Sustainability Standards Board (ISSB) *Illustrative 7
  • 5. Copyright © 2020-2021 by Sattva Media and Consulting Private Ltd. S&P ESG IndiaIndex launched by CRISIL, Standard and Poor, KLD Research & Analytics, was thefirst investible index for Indian enterprises National Voluntary Guideline (NVGs) issued by MCA to offerbusinesses an Indian approach to inculcate responsible business conduct Business Responsibility Report (BRR) SEBI mandated top 100 listed companies by market capitalization to file BRR based on NVGs Integrated Reporting (IR) SEBI advised thetop 500 companies required to file BRR, to adopt IR on voluntary basis National Guidelines on Responsible Business Conduct (NGRBC) released by MCA for ensuring responsible business conduct by businesses Business Responsibility& Sustainability Report (BRSR) for top 1000 listed companies by market capitalization to report voluntarily, mandatory reporting from FY22-23 2008 2009 2012 2014 2017 2019 2021 * applicable for companies with (a) net worth of Rs. 500 crore or more or (b) turnover of Rs. 1000 crore or more or ( c) net profit of the company to be Rs. 5 crore or more In India, the increasing interest towards relevant guidelines & reporting standards, is catching up to the global trend Corporate Social Responsibility (CSR) CSR rules come into force; mandates orgsto spend 2% of average profit on their social responsibility 2016 Green bond guidelines issued by SEBI makingIndia the second country after China to provide national- level guidelines 8
  • 6. Copyright © 2020-2021 by Sattva Media and Consulting Private Ltd. Over the past decade, companies publishing sustainability reports to communicate commitment has continued to grow, and with BRSR, this trend will further increase Key Facts and Insights Risk & Opportunities forbusiness7 Sustainability reporting trendsglobally Sustainability reporting trends inIndia of S&P 500 companies published sustainability reports in 2020 globally in comparison to 20% in 20111 . Source: 1. Link1 Link2 Link3 Link4 Link5 Link6Link7 92% 80% 68% of top 100 companies byrevenue worldwide now report on sustainability5. of sustainability reports mentioned COVID-19 or impact of the pandemic in their sustainability report. of executives confirm the operational impacts of climate- related disasters on business, with more than a quarter facing a scarcity of resources due to climatechange4 . 27% of MSCI India3 constituents publishing sustainabilityreports2 . 97% disclosure rate on employee diversity and opportunitypolicies 95% Indian companies have committed to reducing emissions so far, according to the Science Based Targets initiative (SBTi), a global alliance that helps firms set climategoals6 . 62  Indian companies stand to lose Rs 7.14 lakh Cr to the impact of climate change if they do not take mitigation measures over the next five years, according to the Carbon Disclosure Project’s (CDP) 2020 annualreport.  2/3 multinationals plan to tackle their supply chains’ emissions, a Standard Chartered study of 400 MNCs in June’21 showed. So to continue supplying to global counterparts, Indian companies have to invest into sustainable practices, else they run a risk of losing $274 billion in exports everyyear.  Capital markets are starting to reward companiesmaking systematic investments in climate change and sustainability efforts by pushing their stock priceshigher.  Investors are increasingly using non-financial disclosures to make investment decisions, which in turn is the reason many companies have moved towards integratedfinancial reports. 9
  • 7. Copyright © 2020-2021 by Sattva Media and Consulting Private Ltd. BRSR builds on from BRR reporting to encourage further accountability, transparency and standardization within corporations Attributes Business Responsibility Reporting (BRR) Business Responsibility & Sustainability Reporting (BRSR) Launch year 2012 2021 Applicability criteria Applicable to top 100 listed companies by market capitalization in 2012, to 1000 companies in 2019 Voluntary applicability of BRSR on the top 1000 listed entities by market capitalization for FY 2021-22, and mandatorily be obliged to such reporting from FY2022-23 Underlying guideline National Voluntary Guidelines(NVGs) introduced in 2011 9 principles of National Guidelines on ResponsibleBusiness Conduct (NGRBC) revised in 2019 Primary Reporting Values Integrity & ethics Accountability, greater transparency, cross reporting & interlinkage with other reporting standards, betterdefined performance metrics, uniformity and comparability across industries Reporting mechanism Reporting as a part of annualreports Reporting as a part of annual reports and file to Ministry of Corporate Affairs (MCA) Core Principles Ethics & transparency | Safety | Employee well-being | Stakeholder management | Human rights | Environmental preservation | Public & regulatory policy | Inclusive growth | Customer centric service The 9 principles of NGRBC have been detailed further and mapped to performance indicators that may be mandatory or voluntary (Leadership). The details requested in BRSR warrants leadership accountability, consistency in reporting & ownership of businessimpact. 11
  • 8. Copyright © 2020-2021 by Sattva Media and Consulting Private Ltd. BRSR demands organisations to report in fair amount of detail, however it may have some chances of disparity in quality, depth and uniformity of information Disclosure questions related to: ● Details of the listed entity, products/ services, operations ● Markets served, employees, representation of women, turnover rate for permanent employees ● Holdings, subsidiaries & associate companies ● CSR details, transparency & disclosures compliances Disclosure questions related to: ● Policy & management processes ● Governance, leadership & oversight Essential indicators (Mandatory): ● Data on awareness programs conducted ● Environmental data on energy, emissions, waste, water etc. Leadership indicators (Voluntary): ● Data on life cycle assessments (LCAs), conflict management policy, breakup of energy policy etc. SECTION A General Disclosures SECTION B Management & Process Disclosures SECTION C Principle wise Performance Disclosures 12
  • 9. Copyright © 2020-2021 by Sattva Media and Consulting Private Ltd. SEBI has suggested 2 options for BRSR reporting: one for organisations that have matured and the ones who are embarking the journey BRS R Li t e BRS R Co m p r e h e n s i v e The lite version of the report allows smaller unlisted companies below a certain threshold (currently undefined by SEBI) to adopt a lite version of the BRSR format on a voluntary basis to make it easier for such companies to report on sustainability-related matters Leadership indicators (under Section C) are not mandatory under the lite version of BRSR The underlying principle behind the Lite version is that the implementation of reporting requirements should be done in a phased manner, such that smaller companies get ample timeto adapt and learn from the largerones The reporting of the comprehensive version of BRSR is mandated by SEBI, from FY 22-23, for the top 1000 listed companies in India by marketcapitalization Essential and leadership indicators (under Section C)are mandatory under the comprehensive version ofBRSR The BRSR framework is expected to meet global reporting standards that lay emphasis on ESG related disclosures and enhance contribution towards sustainable growth and development. It is an effective compliance andcommunication tool for a company's non-financialdisclosures The scoring mechanism of BRSR comprises total 300 scores (225 scores under Section A, B, and C- Essential Indicators and 75 scores under Section C- LeadershipIndicators) 13
  • 10. Copyright © 2020-2021 by Sattva Media and Consulting Private Ltd.  Top 20 companies were selected across manufacturing and services industry based on market capitalization  The hypothesis provides us an opportunity to identify large organisations, top in the list and the ones beyond the top ranked, along with mid to small sized organisations that have areas of improvement across ESGparameters  Though reporting levels against theBRSR framework has improved marginally across years, overall disclosure levels were observed to be far from the required levels  The disclosure patterns are consistent across industries, with firms reporting better on Section A: General Information  Data availability is lowest for Section C: the nine Principles  Amongst the principles, data availability is highest across industries for Principles 4 (marginally stakeholders) and 7 (regulatory policy) and lowest for Principles 2(sustainable goods and services), 3 (employee well-being), and 8 (inclusive growth)  Data was sourced against the 198 BRSR attributes through company reports, such as Annual reports, Sustainability / ESG / BRSRreports  Data was analyzed across three financial years - FY19 to FY21  The analysis included reporting on ‘availability’ of data across the required attributes Industry selection Data insights Data collection 1 2 3 Element Details Overview of the research study 15
  • 11. Copyright © 2020-2021 by Sattva Media and Consulting Private Ltd. While there has been a steady progress in disclosure in the past 3 years, the progress is far from satisfactory Sec A General Information Sec B Management & Process Disclosures Sec C Principle-wise Performance Disclosures FY19 FY20 FY21 55 57 59 35 41 46 26 27 29 % availability of information across sections 100% 75-99% 50-74% 25-49% 0-24% Legend >> N =20 16
  • 12. Copyright © 2020-2021 by Sattva Media and Consulting Private Ltd. General information is reported better in comparison to other sections; however, the pattern across sections is consistent across industries Sec A 65% 58% 54% 57% 48% 43% 46% 50% 29% 32% 26% 28% General Information Sec B Management & Process Disclosures Sec C Principle-wise Performance Disclosures BFSI IT Textile Chemical % availability of information across sections(FY21) 100% 75-99% 50-74% 25-49% 0-24% Legend >> N =20 17
  • 13. Copyright © 2020-2021 by Sattva Media and Consulting Private Ltd. Highest disclosures around marginalised stakeholders and regulatory policy, while lowest reporting is on inclusive growth and sustainable goods / services Overall (%) Pr. 8 19% 13% 3% 14% Inclusive Growth BFSI IT Textile Chemicals Pr. 4 Marginalised Stakeholders 100% 100% 100% 100% 100% Pr. 7 Regulatory Policy 100% 100% 100% 100% 100% Pr. 9 Consumer Engagement 38% 39% 46% 32% 33% Pr. 6 Environment Restoration 31% 36% 47% 30% 35% 13% 100% 75-99% 50-74% 25-49% 0-24% Legend >> Pr. 1 Transparent & Accountable Business 28% 28% 31% 25% 26% Pr. 5 Human Rights 27% 27% 24% 29% 28% Pr. 3 Employee Well-being 23% 23% 27% 17% 25% Pr. 2 Sustainable Goods and Services 22% 21% 22% 25% 23% N =20 18
  • 14. Copyright © 2020-2021 by Sattva Media and Consulting Private Ltd. • Majority of the companies (90%) reported on sustainable sourcing, however, only 20% reported on % inputs sourced sustainably • Reporting on usage of recycled input material in production is low (10%) across sectors • Reporting on applicability of Extended Producer Responsibility is low (25%) across sectors • Majority of the companies (75%) reported on environmental / social aspects of products and services • 8 companies reported capital investment on energy conservationequipment • Only 1 company(HDFC) - reported on % R&D / capex investment for improving environment / social aspect of products • 50% of the companies reported on complaints received against directors whereas 9 out of 20 companies reported having a process in place tomanage such conflicts • All companies have reported details of penalties / fines levied by regulatory authorities, however, reporting on corruption complaints is low acrosssectors • Majority of the companies (80%) reported on all attributes pertaining to training details for permanent employees • 100% of the IT companies have reported on all the training attributes • Reporting on trainings for BoD / leadership and contractual workers is low Business Readiness across 9 Principles (1/4) Training Penalties& Corruption Conflicts of Interest PRINCIPLE 1 Reporting on Sust Goods / Services PRINCIPLE 2 Sourcing / EPR 19
  • 15. Copyright © 2020-2021 by Sattva Media and Consulting Private Ltd. • Details on engagement with marginalised stakeholders is well reported (100%) across allsectors Business Readiness across 9 Principles (2/4) Marginalised Stakeholders PRINCIPLE 4 PRINCIPLE 3 Employee Benefits • Majority of the (75%) companies reported on insurances and employee benefits for permanent employees, however reporting for BoD, leadership and workers on the same was low • Health insurance was highest reported across sectors, followed byparental benefits Training • Majority of the companies (80%) have reported on training details of permanent employees, however reporting of gender segregated data is low • IT and textile industries have the best reporting (100%) Hazard • Reporting on occupational health and safety management system attributes and identifying work related hazards islow across sectors • Chemicals firms report better than the rest, on this set of information Safety • Overall, reporting on safety related incidents is low; manufacturing firms (especially chemicals companies) have better reporting than other sectors • Only 5 companies (majority Chemical) reported on assessment of value chain partners Retenti andRevi on ew • Reporting on information pertaining to employee retention and career development reviews is low; incidentally more firms have reported gender segregated numbers as opposed to overalllevels Employee Unions • Majority of the companies (95%) have reported details on employee unions, however only 55% have reported gender segregated numbers 20
  • 16. Copyright © 2020-2021 by Sattva Media and Consulting Private Ltd. NCIPLE 5 Complaints • 12 out of 20 (60%) firms have reported on human rights training provided to permanent employees. However, details on training to contractual employees / workers is not well reported • All companies have reported on POSH complaints, followed by child labor and discrimination at workplace • Manufacturing firms have better reporting on employee complaints than other sectors PRI Remuneration • Majority of the firms (95%) reported on remuneration details for BoDs and leadership, however remunerations details for employees are not well reported(30%) Environment Energy Emissions • Majority of the firms (70%) have reported on scope 1 / scope 2 emissions across sectors. However, only 9 companies reported on emission intensity and even less (4) reported on details pertaining to specific emissions like NOx, SOx etc. Water PRINCIPLE 6 • Energy / emissions attributes are better reported across all sectors, as compared to water and waste attributes • An exception to this is the Textile sector that reported better (50%) on water data • Of the 14 (70%) firms reporting total energy consumption, 12 have reported on consumption from all energy sources • Only 30% companies have reported energyintensity • Only 50% companies reported total water consumption, and even less (~30%) reported consumption from all sources. • Reporting on water intensity is low (15%) across allsectors • While 25% companies reported details on zero liquid discharge mechanism, only ~15% reported coverage • Only manufacturing companies have reported thisdata Business Readiness across 9 Principles (3/4) 21
  • 17. Copyright © 2020-2021 by Sattva Media and Consulting Private Ltd. Business Readiness across 9 Principles (4/4) • 50% (10) of the companies reported on waste management details for any type of waste, whereas only 3 companies reported on all wastegenerated • Overall reporting on e-waste (30%) is higher than other categories - better reporting by services firms on this category • IT sector has the highest reported details on waste management Waste PRINCIPLE 6 PRINCIPLE 7 Industry Associations • All companies have reported on industry associationsmembership PRINCIPLE 8 Sourcing • While 60% of the companies reported on sourcing locally, only 5 reported actual percentage of inputs sourced • Reporting on sourcing from MSME / small producers is low (20%) • While 45% of the companies reported on having a preferential procurement policy, only a few (~5%) reported on the marginalised communities they source from, and percentage of inputssourced PRINCIPLE 9 Consumer Complaints • All companies have reported having a mechanism in place to receive and redress consumer complaints and feedback • Complaints on advertising and unfair trade practices (75% for both) are the highest reported across all sectors • BFSI companies reported better (50%) on data privacycomplaints Cyber Security • 60% of the companies reported having a framework / policy on cyber security and risks related to data privacy • Majority of the IT (100%) and BFSI (83%) companies reported this data Product Information • All companies reported providing information on products / services through various channels / platforms / links • Majority of the companies (85%) reported on having taken steps to inform consumers on safe product usage • All chemical companies reported this data 22
  • 18. Copyright © 2020-2021 by Sattva Media and Consulting Private Ltd. BRSR Report and other reporting standards 4
  • 19. Copyright © 2020-2021 by Sattva Media and Consulting Private Ltd. Going forward, BRSR may serve as the single comprehensive source of non- financial sustainability information relevant to all business stakeholders1 Note: 1.Investors, shareholders, regulators, and public at large 2. Frameworks such as Global Reporting Initiative (GRI), Sustainability Accounting Standards Board (SASB), Task Force on Climate-Related Financial Disclosures (TCFD), Integrated Reporting (<IR>)  As per SEBI, the BRSR guidance note suggests listed companies which prepare and disclose sustainability reports (as part of annual report) based on internationally accepted reporting frameworks2 can cross-reference the disclosures made under such frameworks to the disclosures sought under the BRSR.  In case the data sought in the reporting format is already disclosed in the annual report, the listed entity can provide a cross-reference to the same.  In addition, the organisation may disclose any other relevant sustainability related information at appropriate places in the BRSR report as deemed fit.  The BRSR seeks disclosure of the reporting boundary i.e. whether the reporting is done for the entity on a stand-alone or consolidated basis. Listed entities shall ensure consistency in reporting boundary across the report.  In case disclosures are not applicable, reasons for the same is expected by MCA 24
  • 20. Copyright © 2020-2021 by Sattva Media and Consulting Private Ltd. UN SDGs are the backbone of the Principles of NGRBC; each of the 9 Principles forms the very base of BRSR reporting Integrity, transparency, & accountability Sustainable provision of goods & services Employee well-being Respecting interests of stakeholders Promotion of human rights Protection of the environment Transparent policies & engagement with public Inclusive growth & equitable development 1 2 3 4 5 6 7 8 9 Responsible value provision to consumers 25
  • 21. Copyright © 2020-2021 by Sattva Media and Consulting Private Ltd. Snapshot of other international frameworks that can be cross referenced to BRSR during reporting Name Inception Purpose Information Disclosed Best Suited For Audience E S G Global Reporting Initiative (GRI) 1997  Helps organisations report on economic, social and environmental impact considering various range ofinterests  General disclosures (governance,stakeholder engagement & reporting practices)  Economic impact  Environmental impact  Social impact  Companies of anysize, sector or location  Wide rangeof stakeholders E G Carbon Disclosure Project(CDP) 2002  Captures environmental performance and data related to GHGemissions  Climate changeimpacts  Waterimpacts  Forestimpacts  Supply chain  Publicly listed companies &suppliers looking to manage, disclose carbon footprints  Investor  Procurement  Policymakers E S G International Integrated Reporting Council (IR) 2010  Establishing guiding principles and content, allowing companies to produce integrated report  Environmental impacts  Social capital  Human capital  Business model resilience & innovation  Physical climate change impacts  Leadership & governance  Framework guidance for how information is presented on topics:  Global  Industry-agnostic  Principles-based  High-level elements  Drives connectivity of information  Investors  Lenders 26
  • 22. Copyright © 2020-2021 by Sattva Media and Consulting Private Ltd. Few more of the International reporting frameworks Name Inception Purpose Information Disclosed Best Suited For Audience E S G Sustainability Accounting Standards Board(SASB) 2012  Facilitates disclosure of material sustainability information in SEC filing in US  Environmental impacts  Social capital  Human capital  Business model resilience and innovation  Physical climate change impacts  Leadership and governance  Standard requirementsfor reporting by topic and industry:  United States only  Industry specific  Metrics-based  Disclosure topics and metrics enables compatibility of info  Financial Stakeholde rs E G Task Forceon Climate related Financial Disclosures (TCFD) 2017  Encourages firms to align climate related risks disclosures with investors needs  Governance  Strategy planning including climate change  Risk management  Companies seeking toplan for and mitigate climate- related risks  Wide range of Stakeholde rs E S G International Sustainability Standards Board (ISSB) 2021  Drive a comprehensive baseline with info on sustainability related risks andopportunities  Technical Readiness Working Groups(TRWG)  Climate specific and general requirements prototype sets  Identification, measurement, and disclosure of climate related financial information  Investors, capital market participant s 27
  • 23. Copyright © 2020-2021 by Sattva Media and Consulting Private Ltd. 5 Benefit for Companies
  • 24. Copyright © 2020-2021 by Sattva Media and Consulting Private Ltd. Business case matrix maps the BRSR principles to its attribution of value creation for business BRSR Principles Revenue growth and market access Cost savings and productivity Access to capital Risk management/ license to operate Human capital Brand value/ reputation Integrity, ethics, transparency, accountability Safe and sustainablegoods and services Well-being of organisations employees Respect and responsiveness to all stakeholders Respect and promote human rights Respect, protect and restore the environment Responsible and transparent policy advocacy Promote inclusive growth and equitable development Provide value to consumer responsibly Direct Indirect IMPACT: None 29
  • 25. Copyright © 2020-2021 by Sattva Media and Consulting Private Ltd. • Better operational efficiency and Cost savings • Manage climate related risks that significantly impact their operations, revenue, or expenditures The Business Case Matrix Benefits Financial gain Operational gain Reputational gain perception • Improve brand value & • Fostering innovation and thought leadership • Attract talent • Counter Investor Activism • Reduced regulatory and legal interventions ● Better valuations and stock performance ● Increased access to cheaper equity and debt capital ● Access to markets which require ESG compliance BRSR aims at not mere reporting, but the implementation of the NGRBC principles, thereby effectively addressing the ESG related challenges 30
  • 26. Copyright © 2020-2021 by Sattva Media and Consulting Private Ltd. While companies have increased their thrust on ESG, a direct co-relation of valuation to ESG-related factors is emerging over time  74% of the institutional investors now more likely to “divest” based on poor environmental, social and governance (ESG) performance, than before the COVID-19pandemic.  Vast majority (90%) say they now pay more attention to companies’ ESG performance when making investment decisions, but admit they’ve been slow to take concrete action.  Global sustainable assets have grown at 12%CAGR between 2016 & 2020.  Indian AUM (assets under management) of ESG have risen 370% from INR 2,630 Cr in 2019 to 12,300 Cr in 2021. Source: 2021 EY Global Institutional investor survey | PRI FINANCIAL OPERATIONAL REPUTATIONAL 48 0 39 6 66 3 54 5 77 1 64 4 US UK 53 73 97 3 8 12 1 1 3 BRAZIL INDIA VIETNAM PRI’ssignatories are assetowners and investmentmanagers who havecommitted to integrate ESG factors intoinvestment decisions Pre-Pandemic Post-Pandemic December2019 June2021 In the last six months, the number of signatories to Principles for Responsible Investment (PRI) increased by around 35% As per PRI, Ambit Capital Research 31
  • 27. Copyright © 2020-2021 by Sattva Media and Consulting Private Ltd. As per the MSCI metrices, ESG leaders command higher valuations and mostly perform better than rest of the organisations MSCI ACWI MSCI INDIA ESG Leaders Overall ESG Leaders Overall CAGR % (as on Nov 30, 2021) FINANCIAL OPERATIONAL REPUTATIONAL 1 Year 21.31 19.78 28.07 34.09 3 Year 17.45 16.53 16.77 14.74 5 Year 15.07 14.57 16.61 14.22 10 Year 12.34 11.98 12.30 9.77 Valuations P/E Forward 19.18 17.76 25.05 21.72 P/BV – Price /bookvalue 3.48 3.00 3.79 3.65 Source: MSCI data ACWI(All Country World Index) 32
  • 28. Copyright © 2020-2021 by Sattva Media and Consulting Private Ltd. Incidentally, the investors are also increasingly focusing on ESG to take decisions related to their portfolios LISTED EQUITY REAL ESTATE INFRASTRUCTURE HEDGE FUNDS Percentage of asset owners incorporating ESG issues in their selection 100% 90% 80% 70% 60% 50% 40% 30% 20% 10% 0% FIXED INCOME PRIVATE EQUITY 2020 2021 FINANCIAL OPERATIONAL REPUTATIONAL Source: Principles for responsible investment annual report 2021  2771 signatoriesparticipated inthesurveyand82% of the reporting asset owners said they incorporated ESG factors into their selection, appointment, and monitoring processes thisyear.  86% reported implementing ESG requirements in their requests for proposals, investment management agreements,limited partnership agreements and other appointmentprocesses 33
  • 29. Copyright © 2020-2021 by Sattva Media and Consulting Private Ltd. Impact of climate-related disasters on regular business operations or scarcity of resources to function normally are direct challenges faced by organisations  88% of the research shows that solid ESG practices result in better operational performance of firms.  The most cited environmental issue is operational impact as climate-related events increasingly disrupt business models and supply networksworldwide.  Cost of operation:  Good corporate governance structures such as small and efficient boards and good disclosure policies lead tolower borrowing costs.  Good environmental management practices, such as the installation of pollution abatement measureslowers the cost of operations.  The existence of anti-takeover measures increases a firm’s costof equity and vice versa. Source: Report by Oxford University and Arabesque Partners “From the Stockholder to the Stakeholder” | Deloitte Global climate check report March’21 FINANCIAL OPERATIONAL REPUTATIONAL As per theDeloitteGlobalclimatesurvey of 750 executivesworldwide conducted in Q1 2021 In response to the question - biggestsustainabilityissue faced by theorganisation. 10 % 11 % 14 % 15 % 15 % 16 % 17 % 24 % 26 % 26 % 27 % OPERATIONAL IMPACT OF CLIMATE RELATED DISASTERS (E.G., FACILITIES DAMAGE,… SCARCITY/COST OF RESOURCES (E.G.,FOOD, WATER, ENERGY) REGULATORY/POLITICALUNCERTAINITY INCREASED INSURANCE COSTS OR LACK OF INSURANCE AVAILABILITY REPUTATIONAL DAMAGE SHAREHOLDER PRESSURE/DIVESTMENT COST OF CLIMATE CHANGE MITIGATION REGULATORY COSTS (E.G., CARBON TAX) EMPLOYEE HEALTH, INCLUDING MENTAL HEALTH (E.G., ANXIETY DRIVEN BY… NEED TO MODIFY INDUSTRIAL PROCESSES (E.G., MANUFACTURING) SUPPLY CHAIN DISRUPTION 34
  • 30. Copyright © 2020-2021 by Sattva Media and Consulting Private Ltd. Integrating reputational risk assessment regularly, as part of the company’s overall governance and culture, will continue to prioritize key ESG challenges  Some potential risk triggers identified duringthe survey were –  Social issues like lack of diversity, equality, and inclusion; labour relations; orcommunity impact  Governance risks like compliance failuresor activist investors  Environmental risks like greenhouse gas emissions or waste management impacting the reputation Source: Bloomberg Law ESG Survey 2021 FINANCIAL OPERATIONAL REPUTATIONAL 80 70 60 50 40 30 20 10 0 Company Attracting Compliance U.S. Investor ESG scores EU reputation investment with industry regulatory activists and ranking regulatory standard changes requirements Drivers of decisions to prepare ESG disclosures in 2021 35
  • 31. Copyright © 2020-2021 by Sattva Media and Consulting Private Ltd. Americas European Union As of 2021, at least 30 countries around the world have or have plans in place to institute ESG related reporting, with countries such as France, Australia and Canada being some of the early proponents of ESG reporting in 2001, 2003 & 2004 respectively. Studies at the Swiss Investment institute have supported the argument that: ● Mandatory ESG disclosure increased the accuracy of analysts’ earnings forecasts and lowers analyst forecast dispersion ● ESG’s ability to reduce negative ESG incidents, leads to regulatory changes, and eventually translate into a reduced likelihood of stock price crashes. Eg: BP oil spill in the Gulf of Mexico in 2010 significantly affected market prices ● Effects are strongest if the mandatory disclosure is introduced all at once for E, S, and G and if the relevant authority is a government instead of a national stockexchange  New ESG Regulation Out of Europe Redefines Investment Risk - The EU’s Sustainable Finance Disclosure Regulation (SFDR), which came into effect in March’21, is designed to drive capital toward sustainably-oriented investments.  Under the SFDR, all EU asset managers are asked topublicly disclose their approach to incorporating sustainability considerations in their investmentdecisions The global reforms on ESG that may directly or indirectly influence Indian multinationals and other organisations in the value chain in the future  On June 16, 2021, the U.S. House of Representativespassed legislation that would impose new ESG due diligence and disclosure requirements on publicly tradedcompanies.  They mandated that public companies listed with the U.S. Securities and Exchange Commission (SEC) disclose at their shareholder meetings the link between ESG metrics and thelong- term business strategy" of the company; and "a description of any process" the company uses to "determine the impact of ESG metrics on the long-term business strategy" of the company. 37