Business intelligence prof nikhat fatma mumtaz husain shaikh
•Download as PPTX, PDF•
0 likes•47 views

Prof. Nikhat Fatma Mumtaz Husain Shaikh gave a guest lecture on business intelligence and analytics. She began by defining business intelligence and how analytics builds on it by using data to understand business performance and answer higher-value questions. She then discussed the three levels of analytics - descriptive, predictive, and prescriptive - and gave examples of the business payoffs that can result from building analytic models in each area. The rest of the lecture covered how to build analytic models using tools like Excel, Power BI, data mining software, simulation, and optimization. She recommended textbooks and online courses for learning more and provided examples of free tools to get started with analytics.
Report
Share


Business intelligence prof nikhat fatma mumtaz husain shaikh
- 1. Guest Lecture on Business Intelligence By Prof .Nikhat Fatma Mumtaz Husain Shaikh Wednesday, March 10, 2021 Department of Computer Engineering Sinhgad Institute of Technology and Science, Narhe
- 2. Nikhat Fatma Mumtaz Husain Shaikh • Assistant Professor at K C College of Engineering and Management Studies and Research, Thane • Certified Microsoft Innovative Educator • Life Member of ISTE , CSI , IETE • Certified Neuro Linguistic Programmer by ABNLP twitter.com/ShaikhNik instagram.com/nikshaikh786/
- 3. Disclaimers These slides presented here are obtained from the authors of various books and from various other contributors and websites. I hereby acknowledge all the contributors for their material and inputs. I have tailored the contents to suit the requirements of this webinar.
- 5. 5 Goals for Today’s Session • Know how Analytics builds on Business Intelligence • Know why you’d build an analytic model: business payoffs • Know what kinds of results you can get from analytic models • Know how you’d build your own analytic model, and how to get data into your model • Know what to do next, if you want to learn
- 6. Business Intelligence • Business intelligence (BI) is a technology-driven process for analyzing data and delivering actionable information that helps executives, managers and workers make informed business decisions. • Business intelligence (BI) comprises the strategies and technologies used by enterprises for the data analysis of Business information • They aim to allow for the easy interpretation of these big data. Identifying new opportunities and implementing an effective strategy based on insights can provide businesses with a competitive market advantage and long-term stability.
- 7. 7 How Analytics Builds on Business Intelligence “Analytics are a subset of … business intelligence: a set of technologies and processes that use data to understand business performance … The questions that analytics can answer represent the higher-value and more proactive end of this spectrum.” – Tom Davenport, Competing on Analytics
- 8. 8 Analytics: The Three Levels • Descriptive Analytics: Classic BI • Quantitative Assessment of Past Business Results • Statistics, Exploratory Data Analysis, Visualization • Predictive Analytics • Quantitative Methods to Predict New Outcomes • Forecasting, Prediction, Classification, Association • Prescriptive Analytics • Quantitative Methods to Make Better Decisions • Decision Trees, Monte Carlo Simulation, Optimization
- 9. 9 Why Build Analytic Models: Example Payoffs • Two Frontline Systems Customer Examples • Excel model to optimally deploy 83 employees with different skill sets across 24 stations saved $1.9 million per year in overtime. • Excel simulation model showed major chemical company why a plant was missing goals, and how to solve the problem without any new investment. • U.S. Air Force Air Logistics Center • C-5 Galaxy transport maintenance hub reduced turnaround time from 360 to 160 days, saving taxpayers $50 million and saving soldiers’ lives. • Memorial Sloan-Kettering Cancer Center • Optimizing radiation beams reduced side-effects of treating cancer – improving quality of life and saving $459 million per year on prostate cancer alone.
- 10. 10 Can This Help in Your Work or Career? • Optimization models can deliver huge cost savings • Simulation/risk analysis models can help avoid disaster • But very few business analysts have the skills to do this • If you can do this, your value to your company will rise • Some analytic models address operations, others address strategic decisions • Ex. whether to build a new plant, and where to locate it • Be prepared to present your work to senior management
- 11. 11 Descriptive Analytics: Excel & Power BI • Key task: Data access / shaping – Power Query does this • Excel + Power Pivot data model holds Past Business Results • Pivot charts, Power View, Power BI for data visualization • Formulas: Sum, Count, Average, Min, Max, Var, StdDev
- 12. 12 Predictive Analytics: Data Mining • Key tasks: Data shaping, applying predictive models • Data mining algorithms “fit” analytic model to past data • Trained/fitted models are applied to newly arriving data • Classify: ex. Good/Poor credit risk, Likely/Unlikely to churn • Predict: ex. stock price, house price, exchange rate • Forecast a time series: ex. next sales from past sales history • Associate: ex. People who bought this item also bought... • Tools: Azure ML, XLMiner, Predixion, SAS, SPSS, R, others
- 13. 13 Prescriptive Analytics: Optimization, Simulation • Key task: Create a model – A person (you) must do this • Model must capture essential features of the business situation • Larger models often get their data from BI / Descriptive Analytics • A “What If” model is the starting point – Excel is a natural tool! • Given an appropriate model, we can: • Ask “What are all the possible outcomes?” – simulation/risk analysis • Ask “What’s the best outcome we can achieve?” – optimization • Tools: Solver, Risk Solver, @RISK, Crystal Ball, IBM, SAS, others
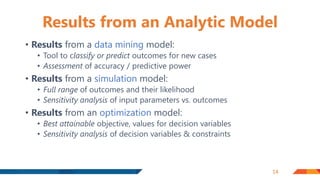
- 14. 14 Results from an Analytic Model • Results from a data mining model: • Tool to classify or predict outcomes for new cases • Assessment of accuracy / predictive power • Results from a simulation model: • Full range of outcomes and their likelihood • Sensitivity analysis of input parameters vs. outcomes • Results from an optimization model: • Best attainable objective, values for decision variables • Sensitivity analysis of decision variables & constraints
- 15. 15 Data Mining: What You Need, How You Do It • What You Need: Tools to • Access / shape data, explore / visualize data • Train / “fit” models to data: machine learning • Validate model results: statistics, Lift / ROC curves • How You Do It • Data “wrangling” / cleaning is usually the first step • Use feature selection to identify variables that matter • Try multiple algorithms: Regression, trees, neural nets • Assess and think about results: Avoid over-fitting
- 16. 16 Simulation: What You Need, How You Do It • What You Need: Tools to • Create a “what if” model, calculating results of interest • Define probability distributions for uncertain inputs • Run Monte Carlo simulation, create statistics and charts • How You Do It • Define distributions by fitting data, or industry practice • Define dependence among inputs: corr. matrices, copulas • Run simulation, or multiple simulations with parameters • Assess and think about results: stats, histograms, scatterplots
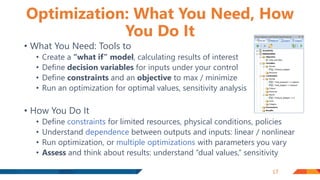
- 17. 17 Optimization: What You Need, How You Do It • What You Need: Tools to • Create a “what if” model, calculating results of interest • Define decision variables for inputs under your control • Define constraints and an objective to max / minimize • Run an optimization for optimal values, sensitivity analysis • How You Do It • Define constraints for limited resources, physical conditions, policies • Understand dependence between outputs and inputs: linear / nonlinear • Run optimization, or multiple optimizations with parameters you vary • Assess and think about results: understand “dual values,” sensitivity
- 18. 18 Can This Help in Your Work or Career? • Optimization models can deliver huge cost savings • Simulation/risk analysis models can help avoid disaster • But very few business analysts have the skills to do this • If you can do this, your value to your company will rise • Some analytic models address operations, others address strategic decisions • Ex. whether to build a new plant, and where to locate it • Be prepared to present your work to senior management
- 19. 19 Where to Learn More: Textbooks on Amazon • Cliff Ragsdale Spreadsheet Modeling 7th Ed • Powell & Baker Management Science 4th Ed • Camm et al Essentials of Business Analytics • James Evans Business Analytics
- 20. 20 Where to Learn More: Online Courses and Tools • www.edx.org • www.coursera.org • www.solver.com • www.xlminer.com
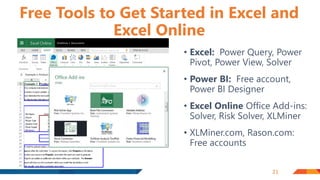
- 21. 21 Free Tools to Get Started in Excel and Excel Online • Excel: Power Query, Power Pivot, Power View, Solver • Power BI: Free account, Power BI Designer • Excel Online Office Add-ins: Solver, Risk Solver, XLMiner • XLMiner.com, Rason.com: Free accounts
- 22. Demonstration of SPSS • SPSS Statistics 25
- 24. Thank You- See You Again!!!!!! Prof. Nikhat Fatma Mumtaz Husain Shaikh nikhat.shaikh@kccemsr.edu.in
Editor's Notes
- If you like what you hear in these webinars, make sure to attend the PASS Business Analytics Conference taking place May 2-4 in San Jose, California. With hands-on learning opportunities from data and business analytics experts and a variety of networking opportunities, the PASS Business Analytics Conference is a great opportunity to gain valuable skills and advance your career. All webinar registrants get $100 off the two-day pass. Just use discount code BAMARA during registration. Visit passbaconference.com to register today!
- If you like what you hear in these webinars, make sure to attend the PASS Business Analytics Conference taking place May 2-4 in San Jose, California. With hands-on learning opportunities from data and business analytics experts and a variety of networking opportunities, the PASS Business Analytics Conference is a great opportunity to gain valuable skills and advance your career. All webinar registrants get $100 off the two-day pass. Just use discount code BAMARA during registration. Visit passbaconference.com to register today!