Business toolkit in Powerpoint and Excel
- 1. 1 Insert your Company & Project names By Former Deloitte & McKinsey Consultants and JP Morgan Investment Bankers Business Templates Business Toolkit in Powerpoint & Excel Trainings Diagrams & Infographics Editable Maps Friday
- 2. 2 Insert your Company & Project names Diagrams, Infographics and Icons Editable Maps 2 3 Business Templates and Trainings1 Table of content
- 3. 3 Insert your Company & Project names 3 Mission Statement tool Objective
- 4. 4 Insert your Company & Project names 4 Mission & Vision • Define the purpose and the scope of the Organization • Provide long-term direction • Reflect C-suite executives’ beliefs, values and priorities Goals • State what must be done to accomplish mission • Identify targets • Serve as guide for objective setting Objectives • Restate objectives into operational terms • Quantify what and when results will be achieved • Guide strategy development Strategy • Express how results will be achieved • Describe what initiatives will be taken to achieve results Execution • Deliver and coordinate a strategy Mission Statement tool Description
- 5. 5 Insert your Company & Project names 5 Mission & Vision • Insert your own text Goals • Insert your own text Objectives • Insert your own text Strategy • Insert your own text Execution • Insert your own text Mission Statement tool Template 1/2
- 6. 6 Insert your Company & Project names 6 Mission Statement tool Template 2/2 • Insert your own text Mission & Vision • Insert your own text Goal • Insert your own text Objective #1 • Insert your own text Objective #2 • Insert your own text Objective #3 • Insert your own text Strategy #1 • Insert your own text Strategy #2 • Insert your own text Strategy #3
- 7. 7 Insert your Company & Project names 7 Porter’s Five Forces tool Objective Click here to download the editable PowerPoint and Excel version at www.slidebooks.com
- 8. 8 Insert your Company & Project names 8 A Commercial Due Diligence (CDD) is usually performed alongside a Financial Due Diligence and a Legal Due diligence InternalExternal FuturePast Financial Due Diligence & Legal Due Diligence (i.e. past and present Income statements, Balance Sheet statements, Cash Flow statements, tax records, etc) Commercial Due Diligence Due Diligence Focus
- 9. 9 Insert your Company & Project names 9 Once you’ve got your “Hypothesis tree” with your Hypothesis, Assumptions, Sub-Assumptions,…it is time to create your work plan Work Plan to validate or invalidate the Assumption “The projected Revenue is reasonable” Sub Assumptions Expected answer Actual Answer Analyses Data Sources End Product Responsibility Deadline There is a logical trend between historic revenues and projected revenues Yes Yes Compare Historic and forcasted revenue CAGR Financial Due Diligence Vertical Histogramme chart Raphael 10 of October The revenue drivers have been identified correctly Yes No Check list of key revenue drivers identified by the management Industry report Driver tree John 13 of October Insert Sub assumptions Insert Sub assumptions Insert Sub assumptions Work Plan Check the Excel sheet provided with the Powerpoint
- 10. 10 Insert your Company & Project names 10 The Strategy Map is used to describe how value is created and should be aligned with the identified key priorities Financial Perspective Customer Perspective Internal Perspective Long-Term Shareholder Value Productivity StrategyGrowth Strategy Improve Cost Structure Improve Asset Utilization Learning & Development Perspective Human Capital Information Capital Organization & Culture Capital Culture Leadership TeamworkAlignment Customer Value Proposition – key segment Price Quality Availability Selection Functionality Service Partnership Brand Product / Service Attributes Relationship Image Selection Acquisition Retention Growth Customer Management Processes Opportunity ID R&D Pipeline Design/Develop Partnerships/JV Ramp-Up Innovation Processes Environment Safety & Health Employer Community Regulatory & Social Processes Increase Customer Value New Revenue Sources Supply Production Distribution Service Risk Management Operations Management Processes
- 11. 11 Insert your Company & Project names 11 Balanced Scorecard Template Mission & Vision TargetsMeasureObjectives Finance TargetsMeasureObjectives Customer TargetsMeasureObjectives Learning and Growth TargetsMeasureObjectives Internal
- 12. 12 Insert your Company & Project names 12 Example of Financial model with scenario and the impact on the 3 financial statements including reusable excel template
- 13. 13 Insert your Company & Project names 13 Example of Discounted cash flow valuation including reusable Excel template
- 14. 14 Insert your Company & Project names 14 Example of CDD Project Plan Step 1: Background Documents Step 2: Internal Kick-Off Step 3: Management meeting Step 4: Analysis of management data Step 5: Desk research Step 6: Interviews Step 7: Financial Modelling Step 8: Report preparation and presentation Days M T W T F M T W T F M T W T F M Week 1 Week 2 Week 3
- 15. 15 Insert your Company & Project names 15 Bargaining power of buyers Porter’s Five Forces Intensity of competitive rivalry Bargaining power of suppliers Threat of new entrants Threat of substitute products Click here to download the editable PowerPoint and Excel version at www.slidebooks.com
- 16. 16 Insert your Company & Project names 16 Bargaining power of buyers Diagram Template Intensity of competitive rivalry Bargaining power of suppliers Threat of new entrants Threat of substitute products
- 17. 17 Insert your Company & Project names 17 Bargaining power of buyers Bargaining power of suppliers Competitive rivalry Threat of substitute products Threat of new entrants Decrease attractiveness Increase attractiveness Neutral Bubble Chart Template Total Industry Attractiveness + + + + AA+
- 18. 18 Insert your Company & Project names 18 0 1 2 3 4 5 Intensity of competitive rivalry Bargaining power of suppliers Threat of substitute products Bargaining power of buyers Threat of new entrants Industry Attractiveness Industry Attractiveness Spider Chart Template
- 19. 19 Insert your Company & Project names 19 • Insert a more comprehensive description Bargaining power of Suppliers • Insert a more comprehensive description Bargaining power of Buyers • Insert a more comprehensive description Rivalry among firms • Insert a more comprehensive description Threat of Substitute products • Insert a more comprehensive description Threat of new entrants Text Template
- 20. 20 Insert your Company & Project names 20 Table & Harvey Balls Template Insert your own text Description ImpactFive Forces Threat of new entrants Insert your own text Threat of substitute products Insert your own text Bargaining power of suppliers Insert your own text Bargaining power of buyers Insert your own text Competitive rivalry
- 21. 21 Insert your Company & Project names 21 Value Chain tool Objective Click here to download the editable PowerPoint and Excel version at www.slidebooks.com
- 22. 22 Insert your Company & Project names 22 Generic Value Chain Customer Value Chain tool Description 1/2 Firm Infrastructure Procurement Human Resource Management Technology Inbound Logistics Operations Outbound Logistics Marketing & Sales After sales Service Support activities Primary activities
- 23. 23 Insert your Company & Project names 23 There are 3 main steps in performing a value chain analysis: Identify the sequential macro activities within your industry/business Identify the main activities for each macro activity Identify which activity brings value to the customer Analyze the main revenue and cost drivers Analyze your strength and weaknesses compared to your competitors Analyze your key areas of improvement Decide which strategy to implement (e.g. outsourcing strategy, acquisition strategy, low cost strategy, etc.) in order to acquire or maintain a sustainable competitive advantage 1.Identify 2.Analyse 3.Decide Value Chain tool Description 2/2
- 24. 24 Insert your Company & Project names 24 Insert your own title Customer Value Chain tool Template 1/7 Insert your own text Insert your own text Insert your own text Insert your own text Insert your own text Insert your own text Insert your own text Insert your own text Insert your own text Support activities Primary activities
- 25. 25 Insert your Company & Project names 25 Value Chain tool Template 2/7 Firm Infrastructure Procurement Human Resource Management Technology Support activities Insert your own text Inbound Logistics Operations Outbound Logistics Marketing & Sales After sales Service Primary activities Insert your own text
- 26. 26 Insert your Company & Project names 26 Value Chain tool Template 3/7 Firm Infrastructure Procurement Human Resource Management Technology Support activities Insert your own text
- 27. 27 Insert your Company & Project names 27 Value Chain tool Template 5/7 Insert your own text Inbound Logistics Operations Outbound Logistics Marketing & Sales Service (After sales support)
- 28. 28 Insert your Company & Project names 28 Value Chain tool Template 6/7 Insert your own text • Insert your own text • Insert your own text • Insert your own text Inbound Logistics Operations Outbound Logistics Marketing & Sales Service (After sales support) Insert your own text • Insert your own text • Insert your own text • Insert your own text Insert your own text • Insert your own text • Insert your own text • Insert your own text Insert your own text • Insert your own text • Insert your own text • Insert your own text Insert your own text • Insert your own text • Insert your own text • Insert your own text
- 29. 29 Insert your Company & Project names 29 Value Chain tool Template 7/7 Insert your own text • Insert your own text • Insert your own text • Insert your own text Inbound Logistics Operations Outbound Logistics Marketing & Sales Service (After sales support) Insert your own text • Insert your own text • Insert your own text • Insert your own text Insert your own text • Insert your own text • Insert your own text • Insert your own text Insert your own text • Insert your own text • Insert your own text • Insert your own text Insert your own text • Insert your own text • Insert your own text • Insert your own text
- 30. 30 Insert your Company & Project names 30 Value Driver tree Objective
- 31. 31 Insert your Company & Project names 31 Company Value Creation Increase net operating profit less adjusted Taxes (NOPLAT) Improve capital allocation Capital deployment Decrease operating expenses Increase gross profit Cost of capital Decrease manufacturing costs Increase revenues Reduce distribution costs Reduce selling costs Reduce R&D costs Reduce administrative costs Improve product mix Increase price Decrease staffing Reduce cost of inputs Lower support functions costs N/A Reduce inventories Optimize scheduling Improve plant utilization Lower Customer Service costs Decrease staffing Improve process Increase volume Optimize physical network Increase productivity Use alternative distribution Increase Accounts payable Improve capital investment Reduce Accounts receivable Value Drivers Value Driver tree Description
- 32. 32 Insert your Company & Project names 32 Insert your text Your text Your text Your text Your text Your text Your text Your text Your text Your text Your text Your text Your text Your text Your text Your text Your text Your text Your text Your text Your text Your text Your text Your text Your text Your text Your text Your text Your text Your text Your text Your text Value Driver tree Template 1/11 Generic Value Drivers Company specific Value Drivers
- 33. 33 Insert your Company & Project names 33 Insert your text Your text Your text Your text Your text Your text Your text Value Driver tree Template 2/11 Your text Your text Your text Your text Your text Your text Your text Your text
- 34. 34 Insert your Company & Project names 34 Value Driver tree Template 7/11 Placeholder Placeholder Placeholder Placeholder Placeholder Placeholder Placeholder
- 35. 35 Insert your Company & Project names 35 Value Driver tree Template 8/11 Text Text Text Text Text Text Text Text Text Text Click here to download the editable PowerPoint and Excel version at www.slidebooks.com
- 36. 36 Insert your Company & Project names 36 Value Driver tree Template 9/11 Text Text Text Text Text Text Text Text Text Text Text Text Text Unit or additional information
- 37. 37 Insert your Company & Project names 37 Value Driver tree Template 10/11 Replace the text by your own text • Replace the text by your own text • Replace the text by your own text Text Text Text Text Text Replace the text by your own text • Replace the text by your own text • Replace the text by your own text Replace the text by your own text • Replace the text by your own text • Replace the text by your own text Replace the text by your own text • Replace the text by your own text • Replace the text by your own text
- 38. 38 Insert your Company & Project names 38 Value Driver tree Template 11/11 Text Text Text Text Text Text strong weak Effect
- 39. 39 Insert your Company & Project names 39 The change commitment curve tool Description Change commitment curve Status Quo COMMITMENT High Low Vision TIME Internalization Individuals make the Vision their own and create innovative ways to use and improve Contact Individuals have heard that there is a vision initiative Awareness Individuals are aware of basic scope and concepts of the Vision Understanding Individuals understand the impacts to their functional area Positive Perception Individuals understand impacts and benefits to them Adoption Individuals are willing to work with and implement the Vision Institutionalization The Vision is the way work is done -- the new status quo 1 2 3 4 5 6 7 Initiatives need to be carried out to decrease the time between the different stages
- 40. 40 Insert your Company & Project names 40 The change commitment curve tool Template Change commitment curve Status Quo COMMITMENT High Low Vision TIME Internalization Insert initiatives Contact Insert initiatives Awareness Insert initiatives Understanding Insert initiatives Positive Perception Insert initiatives Adoption Insert initiatives Institutionalization Insert initiatives 1 2 3 4 5 6 7 Current state Target state
- 41. 41 Insert your Company & Project names 41 Risk versus Reward matrix Objective
- 42. 42 Insert your Company & Project names 42 Risk versus Reward matrix Description 20 A B C Low Reward Risk = Option with an Average Annual Revenue of $100m Insert your key message D High LowHigh This strategic option seems to be the most relevant one Based most of the time on net present value (NPV) and intangible
- 43. 43 Insert your Company & Project names 43 Risk versus Reward matrix Template 20 A B C Low Reward Risk = $100m Average Annual Revenue Insert your key message D High LowHigh
- 44. 44 Insert your Company & Project names 44 4. Market analysis 4.1.Target market - Template • Describe in this text block your target market(s), that is to say the group of customers that you want to market your products to. • To identify your target market(s), you can use customer segmentations such as: o Geographic segmentation o Demographic/socioeconomic segmentation: gender, age, income, occupation, education, household size, and stage in the family life cycle) o Attitudes o Psychological profiles • If you have more than one target market, you ideally will have to tailor your mix marketing (4Ps) for each one of your target markets Target Market description
- 45. 45 Insert your Company & Project names 45 4. Market analysis 4.2.Target market size - Template • Estimate the Total Available Market (TAM) size • TAM refers to the global revenue opportunity available for a product or service • Some sources of information such as government data, trade associations, financial data from major players and customer surveys should help you to provide a rough estimation Total Available Market (TAM) Total Available Market (TAM) Serviceable Available Market (SAM) • Estimate the Serviceable Available Market (SAM) size • SAM refers to the percentage of the Total Available Market (TAM) that you can actually serve Serviceable Available Market (SAM) • Estimate your Target Market size based on your estimation of the TAM and SAM size • Target market refers to the group of customers that you want to market your products to Your Target MarketTarget Market Market Share • Estimate your market share (in percentage and dollars) based on your unique selling proposition and marketing plan • Your market share refers to a percentage of your target market Your Market Share
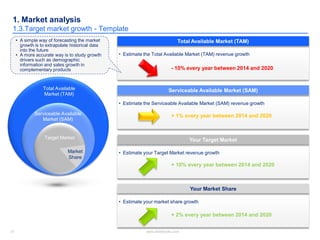
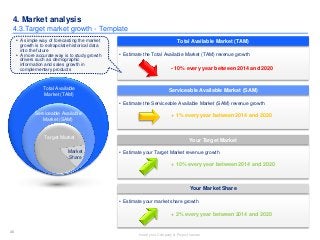
- 46. 46 Insert your Company & Project names 46 4. Market analysis 4.3.Target market growth - Template • Estimate the Total Available Market (TAM) revenue growth Total Available Market (TAM) Total Available Market (TAM) Serviceable Available Market (SAM) • Estimate the Serviceable Available Market (SAM) revenue growth Serviceable Available Market (SAM) • Estimate your Target Market revenue growth Your Target MarketTarget Market Market Share • Estimate your market share growth Your Market Share • A simple way of forecasting the market growth is to extrapolate historical data into the future • A more accurate way is to study growth drivers such as demographic information and sales growth in complementary products - 10% every year between 2014 and 2020 + 1% every year between 2014 and 2020 + 10% every year between 2014 and 2020 + 2% every year between 2014 and 2020
- 47. 47 Insert your Company & Project names 47 Pyramid Principle Definition
- 48. 48 Insert your Company & Project names 48 Create a pyramid with your answer and supporting arguments - Template Insert your answer Insert your supporting argument #1.1 Insert your supporting argument #1.2 Insert your supporting argument #1.3 Insert your supporting argument #2.1 Insert your supporting argument #2.2 Insert your supporting argument #2.3 Insert your supporting argument #3.1 Insert your supporting argument #3.2 Insert your supporting argument #1 Insert your supporting argument #2 Insert your supporting argument #3 Insert your supporting argument #3,3 Insert your introduction’s question Why or How? Why or How?Why or How? Why or How? To communicate in a structured way with a busy executive, you should start with the answer to the executive’s question first, and then list your supporting arguments Group, summarize and order logically your supporting arguments
- 49. 49 Insert your Company & Project names 49 The company can reduce its cost by $5 millions through some operational improvements Select non-core functions Evaluate cost and service level of potential partners Choose one partner for each function Design current processes Compare current process to best-in- class benchmarks Adopt best practices based on benchmarks Select and review current supplier costs Evaluate cost of potential alternative suppliers Outsource non-core functions to save $3 Millions Simplify core functions processes to save $1 Million Review supplier cost to save $1 Million Renegotiate supplier contracts and/or choose alternative suppliers How can the company reduce its cost by 10%? Create a pyramid with your answer and supporting arguments - Example
- 50. 50 Insert your Company & Project names 50
- 51. 51 Insert your Company & Project names 51
- 52. 52 Insert your Company & Project names 52
- 53. 53 Insert your Company & Project names 53
- 54. 54 Insert your Company & Project names Diagrams, Infographics and Icons Editable Maps 2 3 Business Templates and Trainings1 Table of content
- 55. 55 Insert your Company & Project names 55 Business area Insert your own text Insert your own text Insert your own text Insert your own text
- 56. 56 Insert your Company & Project names 56 Communication Insert your own text“ ”
- 57. 57 Insert your Company & Project names 57 Cycle 3D Right your own text Right your own text Right your own text Click here to download the editable PowerPoint version at www.slidebooks.com
- 58. 58 Insert your Company & Project names 58 July 21 Tuesday Thursday Friday Friday July 21 Tuesday Thursday Friday Friday Date
- 59. 59 Insert your Company & Project names 59 Device Computer Tablet SmartPhone Strategy Insert your own text Insert your own text Insert your own text Insert your own text Insert your own text Insert your own text Insert your own text Insert your own text Insert your own text Insert your own text Insert your own text Insert your own text
- 60. 60 Insert your Company & Project names Diagrams, Infographics and Icons Editable Maps 2 3 Business Templates and Trainings1 Table of content
- 61. 61 Insert your Company & Project names 61 Worldwide Map Description 1 Description 2 Description 3 New York 30% 20% 2%
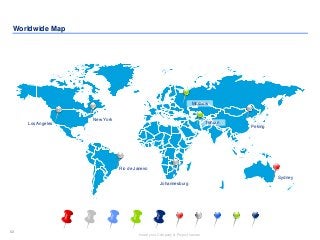
- 62. 62 Insert your Company & Project names 62 Worldwide Map New York Los Angeles Sydney Johannesburg Rio de Janeiro Peking Moscow Tehran
- 63. 63 Insert your Company & Project names 63 Worldwide Map Click here to download the editable PowerPoint and Excel version at www.slidebooks.com
- 64. 64 Insert your Company & Project names 64 Worldwide Map Moscow Tehran New York Los Angeles Sydney Johannesburg Rio de Janeiro Peking
- 65. 65 Insert your Company & Project names 65 Worldwide Map Place holder Place holder Place holder Place holder Place holder Place holder Place holder Place holder Place holder Place holder
- 66. 66 Insert your Company & Project names 66 Worldwide Map Click here to download the editable PowerPoint and Excel version at www.slidebooks.com
- 67. 67 Insert your Company & Project names 67 Worldwide Map Insert your key message
- 68. 68 Insert your Company & Project names 68 Worldwide Map Once you updated one of the former maps, you can add some shadow or other picture effects to your map by following the steps below: 1. Select the whole map 2. Copy and paste it as a picture 3. Click on “Format” and “Picture Style” 4. Test and choose the picture style you prefer 5. In this slide and the following one, you’ll see 2 examples of picture style:
- 69. 69 Insert your Company & Project names 69 Worldwide Map
- 70. 70 Insert your Company & Project names 70 Click here to download the whole 2000 Powerpoint slides and 100 Excel Sheets in an editable version at www.slidebooks.com


