


Carbon Markets
- 1. Consulting on Energy and Climate Change July 2009
- 2. Agenda DEUMAN at a Glance Kyoto Protocol and the Clean Development Mechanism Voluntary Carbon Market (Supply and Demand side) The Carbon Market
- 3. About DEUMAN Launched in the mid 1990’s Main focus is the identification of activities to mitigate climate change Business Units
- 4. About DEUMAN Emission reduction projects in: Chile Perú Ecuador Colombia Nicaragua Panamá Mexico Mozambique
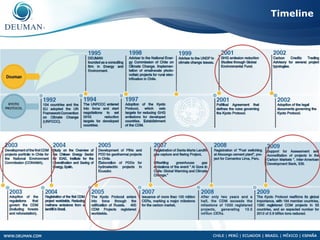
- 5. Timeline
- 6. Agenda DEUMAN at a Glance Kyoto Protocol and the Clean Development Mechanism Voluntary Carbon Management (Supply and Demand side) The Carbon Market
- 7. Road to Regulation 1988 IPCC Foundation, first report 1991 1992 154 countries + UE adopt the UNFCCC 1994 UNFCCC enter into force, GHG target negotiations 1997 The KP is enacted establishing targets and flexible mechanisms 2001 Marrakesh Accords, M&P 2002 Legal documents are adopted, KP
- 8. Flexible Mechanisms Kyoto Protocol The KP established three market-based mechanisms designed to ensure that the industrialized countries (Annex I countries in the UNFCCC) meet their emission reduction targets: International emissions Joint Implementation The Clean Development trading (IET) Mechanism (JI) Mechanism (CDM) Article 17 Article 6 Article 12 Allows the purchase Allows Annex I countries Allows emission and sale of emissions accounting for reductions reduction projects in non among Parties included emissions that are Annex I, to sell their in Annex I to the generated by investing in reductions to Annex I UNFCCC, to fulfill their projects in other Annex I countries, helping them commitments countries to meet their reduction targets
- 9. CDM: Applicability Conditions Voluntary Participation Main focus is the identification of activities to mitigate climate change Real, measurable and long term benefits Contribute to the sustainable development of the host Country Additional Reduce GHG indicated by the KP KP Ratification and DNA in place
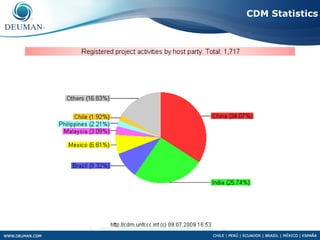
- 11. CDM Statistics • CDM Project Pipeline > 4.200 (2,900,000,000 CERs) • 1717 Registered (1,620,000,000 CERs) • 51 projects currently requesting registration
- 12. CDM Statistics
- 13. CDM Statistics
- 14. Santa Marta Landfill Chile Project Characteristics • Capture and flaring of biogas in Santa Marta Landfill • Approximately 70,000 tones of domestic solid waste disposed each month (2002-2022) • World Class Landfill • RCA – AN – PDD – Val& Reg - MR – Ver • Currently 40kton were verified and 190kton in verification
- 15. Cementos Lima Fuel Switching Peru Project Characteristics • Change fuel in cement kilns, coal to natural gas • High consumption of fossil fuels Potencial 300,000 tonCO2e/año • AN – Meth - PDD – Val&Reg • Marketing
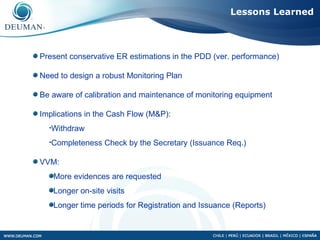
- 16. Lessons Learned Present conservative ER estimations in the PDD (ver. performance) Need to design a robust Monitoring Plan Be aware of calibration and maintenance of monitoring equipment Implications in the Cash Flow (M&P): •Withdraw •Completeness Check by the Secretary (Issuance Req.) VVM: More evidences are requested Longer on-site visits Longer time periods for Registration and Issuance (Reports)
- 17. Agenda DEUMAN at a Glance Kyoto Protocol and the Clean Development Mechanism Voluntary Carbon Management (Supply and Demand side) The Carbon Market
- 18. Voluntary Carbon Market A MARKET PARALLEL TO THE CDM GHG REDUCTIONS ARE VERIFIED UNDER SEVERAL STANDARDS WHICH ARE NOT WITHIN THE SCOPE OF THE FLEXIBLE MECHANISMS UNDER THE KYOTO PROTOCOL CHICAGO CLIMATE OTC MARKET (Over EXCHANGE the Counter) • Cap-and-trade System • Bilateral Accords • Voluntary • Voluntary • Legally Binding • Not legally binding
- 19. Voluntary Carbon Market FACTORS THAT ORIGINATE THE VOLUNTARY CARBON MARKET Countries that have not ratified the KP No Approved Methodologies or not applicable Small Project Activities that cannot run with CDM transaction costs Agile certification process, through independent (non-UN) standards. Offsetting demand from non-compliance entities.
- 20. Voluntary Carbon Market rapid growth and depth. Its reduction units are VER and each VER equals 1 ton of CO2e reduced. The levels of demand in many cases are similar to the CDM. Prices are roughly between 25% and 30% of the CERs. 15 4 42 34 38 5 22
- 21. Voluntary Carbon Market Standards PLAN VIVO
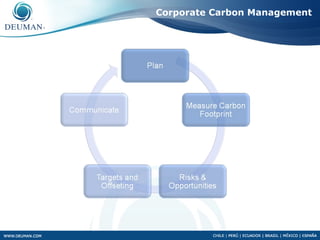
- 22. Corporate Climate Change Strategy “Companies that quantify their emissions footprint sent a strong signal that they recognize the importance of climate change as a business risk, as well as an opportunity” Climate Change Global Impact Long Term Problem Irreversible damage Risks associated with climate change Regulatory risk. Risk in the supply chain (suppliers of steel, aluminum, glass, etc.). Risks of litigation. Reputation risk.
- 23. International Scenario CDP and Carbon Tax
- 25. Voluntary Carbon Market Al Gore event on Climate Change - Chile Expoambiental 2007 II Renewable Energy Meeting Cono Sur Vineyard Tarapacá Vineyard Casablanca Vineyard
- 26. Agenda DEUMAN at a Glance Kyoto Protocol and the Clean Development Mechanism Voluntary Carbon Management (Supply and Demand side) The Carbon Market
- 27. Recently Founded. Privately Owned. Solely dedicated to the carbon market. For the time being, acting as primary CER and VER brokerage and advisory firm. Brokers in firm have closed deals in excess of 5 million CERs/ERUs, 2 million VERs, and 1.2 million EUAs.
- 28. CER Price Drivers WHY ARE CERs WORTH SOMETHING? European National Allocation Plans (PNAs) allow the use of CERs for compliance purposes, enabling a swap between CERs and EUAs (credits traded under the European Trading Scheme) Some buyers, such as Japanese, purchase CERs for voluntary offsetting their carbon footprint. CERs are considered a by-product of a CDM project, whose final objective is to reduce emissions in the host countries.
- 29. CER EUA Correlation CER vs EUA 30 25 EUA SPOT 20 EURO CER SPOT 15 MAX PRIMARY CER 10 MIN PRIMARY CER 5 0 8/12/2008 10/12/2008 1/12/2009 2/12/2009 9/12/2008 11/12/2008 12/12/2008 FECHA MM/DD/YR
- 30. CER Correlation SOME ANALYSTS CLAIM THAT CERs ARE CORRELATED TO: The EUA. If it weren’t for the EUA-CER swap, the CER would lose it’s main price driver. If the EUA falls, the CER should fall in order to maintain a certain spread (price difference) among both credits. Coal-Gas Fuel Switch. Depending on the price of the EUA, power generators, theoretically, use coal or gas for power generation. In fact, this switch is hardly employed. Oil Prices. Most gas supply contracts are indexed to oil prices. Building on the coal-gas switch, oil should have an impact on the EUA through the Coal-gas switch. In reality if the correlation with coal-gas switch is flawed, so is this. Power prices. Utilities make up most of the European Trading Scheme, if they sell less power, they need less demand for EUAs and start selling, provoking an increased offer.
- 31. CER Price Assessments Price of CER (in Euros). Secondary Market
- 32. CER Market at a Glance WHAT DEFINES THE CER MARKET: (Lack of) Liquidity. Secondary CER Market is small, daily liquidity as shown in Bluenext is currently at around 50k-100k CER daily. Most deals are done in OTC. However, the secondary market is valued at approximately 50 billion Euro for the year 2008. Primary CER Market is even smaller, roughly valued at 5 billion Euro for the year 2008 Large amount of legal and administrative hurdles, affecting the timely issuance of CERs and therefore affecting the market offer side. Legal uncertainty. We lack a post-Kyoto (2012) legal framework that will assure us we can still use CERs for compliance within the EU ETS. CERs require a multi-faceted approach, including financial, engineering, legal and administrative expertise.