Location via proxy:   [ UP ]  
[Report a bug]   [Manage cookies]                
SlideShare a Scribd company logo
DR NILESH KATE
MBBS,MD
ASSOCIATE PROF
DEPT. OF PHYSIOLOGY
CARDIAC
OUTPUT - I
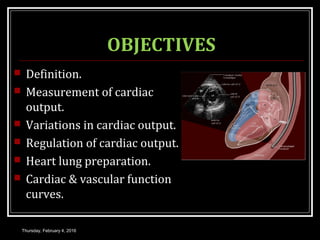
OBJECTIVES
 Definition.
 Measurement of cardiac
output.
 Variations in cardiac output.
 Regulation of cardiac output.
 Heart lung preparation.
 Cardiac & vascular function
curves.
Thursday, February 4, 2016
Some Facts………
 Is about 4.8 inches tall and 3.35 inches wide
 Weighs about .68 lb. in men and .56 lb. in women
 Beats about 100,000 times per day
 Beats 2.5 billion time in an average 70 yr. lifetime
 Pumps about 2000 gallons of blood each day
 Circulates blood completely 1000 times each day
 Pumps blood through 62,000 miles of vessels
 Suffers 7.2 mil. CAD deaths worldwide each year
Thursday, February 4, 2016
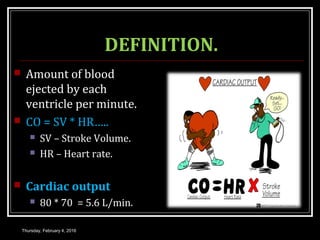
DEFINITION.
 Amount of blood
ejected by each
ventricle per minute.
 CO = SV * HR…..
 SV – Stroke Volume.
 HR – Heart rate.
 Cardiac output
 80 * 70 = 5.6 L/min.
Thursday, February 4, 2016
SIGNIFICANCE
 It’s the cardiac output
that decides the rate of
blood flow to the
different parts of the
body.
 Decrease in cardiac
output
 Decrease in blood flow
Thursday, February 4, 2016
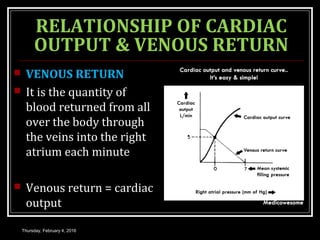
RELATIONSHIP OF CARDIAC
OUTPUT & VENOUS RETURN
 VENOUS RETURN
 It is the quantity of
blood returned from all
over the body through
the veins into the right
atrium each minute
 Venous return = cardiac
output
Thursday, February 4, 2016
Components…….
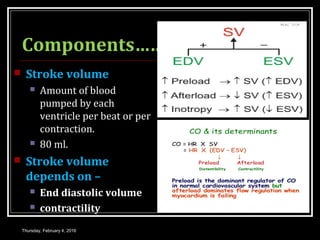
 Stroke volume
 Amount of blood
pumped by each
ventricle per beat or per
contraction.
 80 ml.
 Stroke volume
depends on –
 End diastolic volume
 contractility
Thursday, February 4, 2016
Components…….
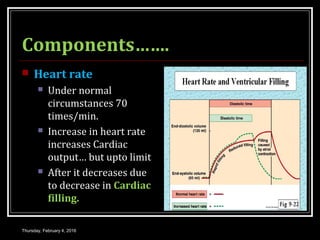
 Heart rate
 Under normal
circumstances 70
times/min.
 Increase in heart rate
increases Cardiac
output… but upto limit
 After it decreases due
to decrease in Cardiac
filling.
Thursday, February 4, 2016
MINUTE VOLUME
It is the amount of
blood pumped out
by each ventricle per
minute.
MINUTE VOLUME =
Stroke volume x HR
Normal value:
5litres/ventricle/minut
e.
Thursday, February 4, 2016
CARDIAC INDEX.
 Cardiac output
is the amount of blood
pumped out per ventricle
per minute per square
meter of body surface area.
 Expressed in relation to the
body surface area.
 Normal value –
3.2L/min/m2
Thursday, February 4, 2016
CARDIAC RESERVE.
 Maximum increase in
the cardiac output
above the normal value.
 Expressed in
Percentage.
 Normal values.
 Adults – 300-400%
 Old age – 200-250%
 Athletes – 500-600%
 Variations
 Maximum – Heavy
exercise.
 Minimum – Cardiac
diseases.
Thursday, February 4, 2016
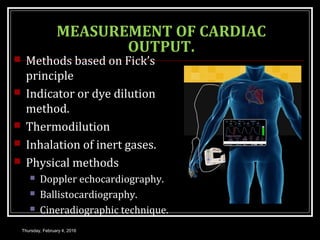
MEASUREMENT OF CARDIAC
OUTPUT.
 Methods based on Fick’s
principle
 Indicator or dye dilution
method.
 Thermodilution
 Inhalation of inert gases.
 Physical methods
 Doppler echocardiography.
 Ballistocardiography.
 Cineradiographic technique.
Thursday, February 4, 2016
METHODS BASED ON FICK’S
PRINCIPLE
 Fick’s principle –
Amount of substance
taken up by an organ
per unit of time (Q) is
equal to the arterial
level of the substance
(A) – venous level of
substance (V) × Blood
flow(F)
 Q = (A-V) F
 F = Q
-------
(A-V)
 2 methods
 Direct
 Indirect
Thursday, February 4, 2016
METHODS BASED ON FICK’S
PRINCIPLE
Thursday, February 4, 2016
DIRECT METHOD.
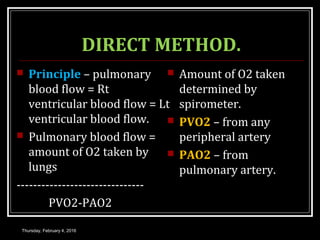
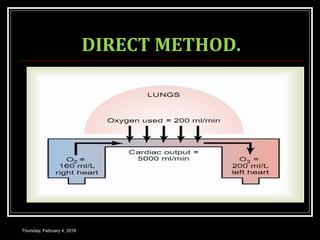
 Principle – pulmonary
blood flow = Rt
ventricular blood flow = Lt
ventricular blood flow.
 Pulmonary blood flow =
amount of O2 taken by
lungs
-------------------------------
PVO2-PAO2
 Amount of O2 taken
determined by
spirometer.
 PVO2 – from any
peripheral artery
 PAO2 – from
pulmonary artery.
Thursday, February 4, 2016
DIRECT METHOD.
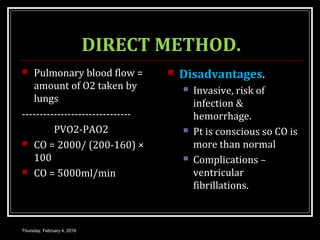
 Pulmonary blood flow =
amount of O2 taken by
lungs
-------------------------------
PVO2-PAO2
 CO = 2000/ (200-160) ×
100
 CO = 5000ml/min
 Disadvantages.
 Invasive, risk of
infection &
hemorrhage.
 Pt is conscious so CO is
more than normal
 Complications –
ventricular
fibrillations.
Thursday, February 4, 2016
DIRECT METHOD.
Thursday, February 4, 2016
INDIRECT METHOD.
 Same as direct
method only
 CO2 excretion by lungs
is measured by
spirometry.
 PACO2 from alveolar
air.
 PVCO2 – Rebreathing
into closed bag.
 CO = CO2 output/min
----------------------
PACO2-PVCO2
Thursday, February 4, 2016
INDICATOR OR DYE DILUTION
METHOD.
 Principle – Known
amount of dye injected
into Rt atrium & mean
concentration of its
first passage through
an artery is
determined.
 Blood flow (F)= Q/Ct
 F = blood flow in
L/min.
 Q= quantity of dye
injected.
 C = Mean Conc. of dye.
 T = Time duration in
sec of first passage of
dye.
Thursday, February 4, 2016
IDEAL INDICATOR.
 Should be nontoxic.
 Mix evenly.
 Easy to measure.
 Not alter cardiac output
or haemodynamic.
 Not be changed by
body.
 E.g. Evan’s blue,
radioactive isotopes.
Thursday, February 4, 2016
PROCEDURE.
 5 mg of Evan’s blue dye
mixed with venous blood.
 Duration of first passage
of dye(t) & mean conc of
dye (C) in arterial blood
estimated.
 CO= Q/ct × 60 = 5/1.5L
×40 × 60 = 5 L/min
Thursday, February 4, 2016
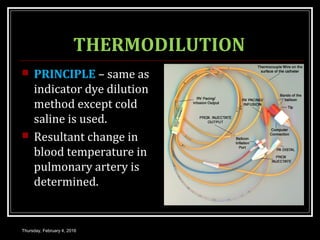
THERMODILUTION
 PRINCIPLE – same as
indicator dye dilution
method except cold
saline is used.
 Resultant change in
blood temperature in
pulmonary artery is
determined.
Thursday, February 4, 2016
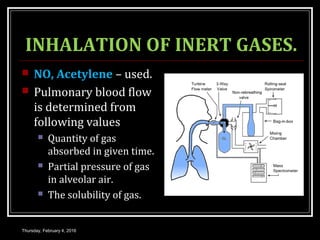
INHALATION OF INERT GASES.
 NO, Acetylene – used.
 Pulmonary blood flow
is determined from
following values
 Quantity of gas
absorbed in given time.
 Partial pressure of gas
in alveolar air.
 The solubility of gas.
Thursday, February 4, 2016
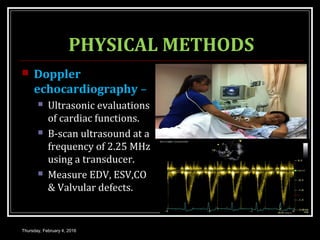
PHYSICAL METHODS
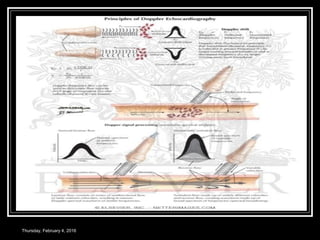
 Doppler
echocardiography –
 Ultrasonic evaluations
of cardiac functions.
 B-scan ultrasound at a
frequency of 2.25 MHz
using a transducer.
 Measure EDV, ESV,CO
& Valvular defects.
Thursday, February 4, 2016
PHYSICAL METHODS
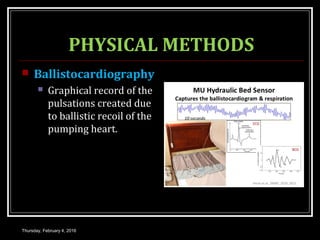
 Ballistocardiography
 Graphical record of the
pulsations created due
to ballistic recoil of the
pumping heart.
Thursday, February 4, 2016
PHYSICAL METHODS
 CINERADIOGRAPHIC
TECHNIQUE.
 The making of a motion
picture record of successive
images appearing on a
fluoroscopic screen.
 Radiography of an organ in
motion, for example, the
heart, the gastrointestinal
tract.
Thursday, February 4, 2016
VARIATIONS IN CARDIAC
OUTPUT.
 Physiological causes.
 Age – CI children >
adult.
 Sex – females > Males
 Diurnal variations-
low in early morning.
 Environmental
temperature – direct
relation.
 Anxiety excitement,
Eating, Exercise,
Pregnancy, High
altitude – direct
relation.
 Posture change –
sitting or standing >
lying down due to
venous pooling.
Thursday, February 4, 2016
VARIATIONS IN CARDIAC
OUTPUT.
 Pathological – its
mainly due to low
peripheral resistance
 Increase
 Fever
 Anemia.
 Hyperthyroidism.
 Beriberi
 Arteriovenous fistula
Thursday, February 4, 2016
VARIATIONS IN CARDIAC
OUTPUT.
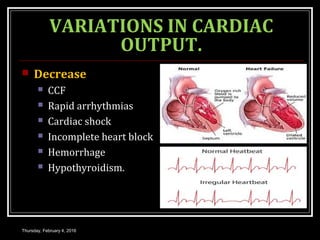
 Decrease
 CCF
 Rapid arrhythmias
 Cardiac shock
 Incomplete heart block
 Hemorrhage
 Hypothyroidism.
Thursday, February 4, 2016
Thank you.
Thursday, February 4, 2016
More Related Content

Cardiac output 1

  • 1. DR NILESH KATE MBBS,MD ASSOCIATE PROF DEPT. OF PHYSIOLOGY CARDIAC OUTPUT - I
  • 2. OBJECTIVES  Definition.  Measurement of cardiac output.  Variations in cardiac output.  Regulation of cardiac output.  Heart lung preparation.  Cardiac & vascular function curves. Thursday, February 4, 2016
  • 3. Some Facts………  Is about 4.8 inches tall and 3.35 inches wide  Weighs about .68 lb. in men and .56 lb. in women  Beats about 100,000 times per day  Beats 2.5 billion time in an average 70 yr. lifetime  Pumps about 2000 gallons of blood each day  Circulates blood completely 1000 times each day  Pumps blood through 62,000 miles of vessels  Suffers 7.2 mil. CAD deaths worldwide each year Thursday, February 4, 2016
  • 4. DEFINITION.  Amount of blood ejected by each ventricle per minute.  CO = SV * HR…..  SV – Stroke Volume.  HR – Heart rate.  Cardiac output  80 * 70 = 5.6 L/min. Thursday, February 4, 2016
  • 5. SIGNIFICANCE  It’s the cardiac output that decides the rate of blood flow to the different parts of the body.  Decrease in cardiac output  Decrease in blood flow Thursday, February 4, 2016
  • 6. RELATIONSHIP OF CARDIAC OUTPUT & VENOUS RETURN  VENOUS RETURN  It is the quantity of blood returned from all over the body through the veins into the right atrium each minute  Venous return = cardiac output Thursday, February 4, 2016
  • 7. Components…….  Stroke volume  Amount of blood pumped by each ventricle per beat or per contraction.  80 ml.  Stroke volume depends on –  End diastolic volume  contractility Thursday, February 4, 2016
  • 8. Components…….  Heart rate  Under normal circumstances 70 times/min.  Increase in heart rate increases Cardiac output… but upto limit  After it decreases due to decrease in Cardiac filling. Thursday, February 4, 2016
  • 9. MINUTE VOLUME It is the amount of blood pumped out by each ventricle per minute. MINUTE VOLUME = Stroke volume x HR Normal value: 5litres/ventricle/minut e. Thursday, February 4, 2016
  • 10. CARDIAC INDEX.  Cardiac output is the amount of blood pumped out per ventricle per minute per square meter of body surface area.  Expressed in relation to the body surface area.  Normal value – 3.2L/min/m2 Thursday, February 4, 2016
  • 11. CARDIAC RESERVE.  Maximum increase in the cardiac output above the normal value.  Expressed in Percentage.  Normal values.  Adults – 300-400%  Old age – 200-250%  Athletes – 500-600%  Variations  Maximum – Heavy exercise.  Minimum – Cardiac diseases. Thursday, February 4, 2016
  • 12. MEASUREMENT OF CARDIAC OUTPUT.  Methods based on Fick’s principle  Indicator or dye dilution method.  Thermodilution  Inhalation of inert gases.  Physical methods  Doppler echocardiography.  Ballistocardiography.  Cineradiographic technique. Thursday, February 4, 2016
  • 13. METHODS BASED ON FICK’S PRINCIPLE  Fick’s principle – Amount of substance taken up by an organ per unit of time (Q) is equal to the arterial level of the substance (A) – venous level of substance (V) × Blood flow(F)  Q = (A-V) F  F = Q ------- (A-V)  2 methods  Direct  Indirect Thursday, February 4, 2016
  • 14. METHODS BASED ON FICK’S PRINCIPLE Thursday, February 4, 2016
  • 15. DIRECT METHOD.  Principle – pulmonary blood flow = Rt ventricular blood flow = Lt ventricular blood flow.  Pulmonary blood flow = amount of O2 taken by lungs ------------------------------- PVO2-PAO2  Amount of O2 taken determined by spirometer.  PVO2 – from any peripheral artery  PAO2 – from pulmonary artery. Thursday, February 4, 2016
  • 16. DIRECT METHOD.  Pulmonary blood flow = amount of O2 taken by lungs ------------------------------- PVO2-PAO2  CO = 2000/ (200-160) × 100  CO = 5000ml/min  Disadvantages.  Invasive, risk of infection & hemorrhage.  Pt is conscious so CO is more than normal  Complications – ventricular fibrillations. Thursday, February 4, 2016
  • 18. INDIRECT METHOD.  Same as direct method only  CO2 excretion by lungs is measured by spirometry.  PACO2 from alveolar air.  PVCO2 – Rebreathing into closed bag.  CO = CO2 output/min ---------------------- PACO2-PVCO2 Thursday, February 4, 2016
  • 19. INDICATOR OR DYE DILUTION METHOD.  Principle – Known amount of dye injected into Rt atrium & mean concentration of its first passage through an artery is determined.  Blood flow (F)= Q/Ct  F = blood flow in L/min.  Q= quantity of dye injected.  C = Mean Conc. of dye.  T = Time duration in sec of first passage of dye. Thursday, February 4, 2016
  • 20. IDEAL INDICATOR.  Should be nontoxic.  Mix evenly.  Easy to measure.  Not alter cardiac output or haemodynamic.  Not be changed by body.  E.g. Evan’s blue, radioactive isotopes. Thursday, February 4, 2016
  • 21. PROCEDURE.  5 mg of Evan’s blue dye mixed with venous blood.  Duration of first passage of dye(t) & mean conc of dye (C) in arterial blood estimated.  CO= Q/ct × 60 = 5/1.5L ×40 × 60 = 5 L/min Thursday, February 4, 2016
  • 22. THERMODILUTION  PRINCIPLE – same as indicator dye dilution method except cold saline is used.  Resultant change in blood temperature in pulmonary artery is determined. Thursday, February 4, 2016
  • 23. INHALATION OF INERT GASES.  NO, Acetylene – used.  Pulmonary blood flow is determined from following values  Quantity of gas absorbed in given time.  Partial pressure of gas in alveolar air.  The solubility of gas. Thursday, February 4, 2016
  • 24. PHYSICAL METHODS  Doppler echocardiography –  Ultrasonic evaluations of cardiac functions.  B-scan ultrasound at a frequency of 2.25 MHz using a transducer.  Measure EDV, ESV,CO & Valvular defects. Thursday, February 4, 2016
  • 26. PHYSICAL METHODS  Ballistocardiography  Graphical record of the pulsations created due to ballistic recoil of the pumping heart. Thursday, February 4, 2016
  • 27. PHYSICAL METHODS  CINERADIOGRAPHIC TECHNIQUE.  The making of a motion picture record of successive images appearing on a fluoroscopic screen.  Radiography of an organ in motion, for example, the heart, the gastrointestinal tract. Thursday, February 4, 2016
  • 28. VARIATIONS IN CARDIAC OUTPUT.  Physiological causes.  Age – CI children > adult.  Sex – females > Males  Diurnal variations- low in early morning.  Environmental temperature – direct relation.  Anxiety excitement, Eating, Exercise, Pregnancy, High altitude – direct relation.  Posture change – sitting or standing > lying down due to venous pooling. Thursday, February 4, 2016
  • 29. VARIATIONS IN CARDIAC OUTPUT.  Pathological – its mainly due to low peripheral resistance  Increase  Fever  Anemia.  Hyperthyroidism.  Beriberi  Arteriovenous fistula Thursday, February 4, 2016
  • 30. VARIATIONS IN CARDIAC OUTPUT.  Decrease  CCF  Rapid arrhythmias  Cardiac shock  Incomplete heart block  Hemorrhage  Hypothyroidism. Thursday, February 4, 2016