Location via proxy:   [ UP ]  
[Report a bug]   [Manage cookies]                
SlideShare a Scribd company logo
Q3 FY 2008 Earnings Call

                    FY 2008
Essential to care


                                 May 1, 2008
Forward-looking statements and
    GAAP reconciliation
This presentation contains forward-looking statements addressing expectations, prospects, estimates
and other matters that are dependent upon future events or developments. These matters are subject
to risks and uncertainties that could cause actual results to differ materially from those projected,
anticipated or implied. The most significant of these uncertainties are described in Cardinal Health's
Form 10-K, Form 10-Q and Form 8-K reports (including all amendments to those reports) and exhibits
to those reports, and include (but are not limited to) the following: competitive pressures in Cardinal
Health's various lines of business; the loss of one or more key customer or supplier relationships or
changes to the terms of those relationships; uncertainties relating to the timing of generic or branded
pharmaceutical introductions and the frequency or rate of branded pharmaceutical price appreciation or
generic pharmaceutical price deflation; changes in the distribution patterns or reimbursement rates for
healthcare products and/or services; the results, consequences, effects or timing of any inquiry or
investigation by any regulatory authority or any legal or administrative proceedings; future actions of
regulatory bodies or government authorities relating to Cardinal Health's manufacturing or sale of
products and other costs or claims that could arise from its manufacturing, compounding or
repackaging operations or from its other services; the costs, difficulties and uncertainties related to the
integration of acquired businesses; uncertainties relating to the amount of future share repurchases by
Cardinal Health, which can be affected by Cardinal Health's then-current stock price, regulatory
restraints on share repurchases, cash flows, financial condition and alternative uses of cash available to
Cardinal Health at the time, as well as by the amount of any additional share repurchases authorized by
the board of directors; conditions in the pharmaceutical market and general economic and market
conditions. This presentation reflects management’s views as of May 1, 2008. Except to the extent
required by applicable law, Cardinal Health undertakes no obligation to update or revise any forward-
looking statement. In addition, this presentation includes non-GAAP financial measures. Cardinal
Health provides definitions and reconciling information at the end of this presentation and on its investor
relations page at www.cardinalhealth.com.


                                                                                                     2
Agenda
Opening remarks      Kerry Clark
                     Chairman and Chief Executive Officer

Financial overview   Jeff Henderson
                     Chief Financial Officer

HSCS-P Comments      George Barrett
                     Vice Chairman and CEO
                     Healthcare Supply Chain Services

Q&A                  Kerry Clark
                     Jeff Henderson
                     George Barrett
                     Dave Schlotterbeck
                     Vice Chairman and CEO
                     Clinical and Medical Products


                                                     3
Financial Overview
•   FY 2008 Q3 Results – Consolidated
•   FY 2008 Q3 Results – Business Segments
•   Key Financial Value Drivers
•   FY 2008 Q4 and Full Year Financial Targets
    and Comments


                                                 4
Q3 FY 2008 Recap
                                   GAAP Basis         Non-GAAP Basis
                                              %                           %
                                            Change1                     Change1
                                  ($M)                 ($M)
                                  $22,910     5%
Revenue

                                             n.m2
                                    $577                 $613               1%
Operating earnings

                                             n.m2
                                    $366                 $390                 -
Earnings from continuing ops

                                             n.m2
                                    $1.02               $1.08              13%
Diluted EPS from continuing ops


                                    $897
Operating cash flow

                                   19.6%                21.3%
Return on equity


                                                         1%   change over prior year quarter
                                                         2Prior year negative

                                                                                  5
Q3 Operating Earnings and EPS

                                 Q3 FY 2008                           Q3 FY 2007
                        Operating      Diluted EPS from      Operating      Diluted EPS from
                     Earnings/(Loss)       Continuing     Earnings/(Loss)       Continuing
                          ($M)             Operations          ($M)             Operations


GAAP Consolidated        $577               $1.02              ($10)            ($0.01)


Special Items             $36               $0.06             $612               $0.96
Impairment Charges
& Other                   $1                $0.00              $4                $0.01
Non-GAAP
Consolidated             $613               $1.08             $606               $0.96


                                                                                          6
Healthcare Supply Chain Services – Pharmaceutical
    Business Analysis

                                                    Q3 FY08           Q3 FY07
                                                     ($M)              ($M)              % Change
Revenue                                                 19,894            19,246                    3%
Segment Profit                                              300               380              (21%)


Highlights:
• Revenue up 3% on increased sales to existing bulk customers
• Segment profit down 21%, driven by customer repricings, controlled substance anti-diversion
  impact and negative comparison to DSA benefit of $15.8M in Q3 FY07 (earned in CY06)
• Tangible capital improved 1%1 reflecting continued focus on capital efficiency; days inventory on
  hand improved by 2 days versus prior year


                                                                                 1Non-GAAP   financial measure


                                                                                                          7
Healthcare Supply Chain Services – Medical
    Business Analysis

                                                    Q3 FY08           Q3 FY07
                                                     ($M)              ($M)             % Change
Revenue                                                  2,066             1,907                8%
Segment Profit                                               93                89               5%


Highlights:
• Revenue up 8% on increased penetration and sales to existing hospital, laboratory, and ambulatory
  customers
• Segment profit up 5%, driven by sales volume increase, partially offset by the previously disclosed
  change in corporate allocation, and continued softness in the surgical kitting business
• Corporate allocation change negatively impacted segment profit by approximately 6 pps
• Tangible capital improved 4%1


                                                                                  1Non-GAAP   financial measure


                                                                                                         8
Medical Products and Technologies
    Business Analysis

                                                   Q3 FY08           Q3 FY07
                                                    ($M)              ($M)            % Change
Revenue                                                   679               458           48%
Segment Profit                                              80                47          72%


Highlights:
• Revenue up 48%, driven by the VIASYS acquisition (38 pps) and growth within the core infection
  prevention and medical specialty businesses (10 pps), including the benefit of foreign exchange (4 pps)
• Segment profit up 72% on the VIASYS addition (52 pps) and strong organic growth (20 pps), including
  the benefit of foreign exchange (11 pps)
• VIASYS integration remains ahead of schedule for FY08 synergies; sales force integration and
  manufacturing rationalization are in-progress


                                                                                                 9
Clinical Technologies and Services
    Business Analysis

                                                    Q3 FY08           Q3 FY07
                                                     ($M)              ($M)             % Change
Revenue                                                    747                674          11%
Segment Profit                                             127                 98          29%


Highlights:
• Revenue up 11% over prior year on strong installation for Pyxis medication and supply dispensing
  products and Alaris infusion products, dampened in part by a slowdown in pharmacy services
• Segment profit up 29%, driven by favorable product mix and improved operating leverage, partially
  offset by the $6.5M charge for the voluntary recall of integrated circuits and connecters on certain
  Alaris® System modules
• Segment profit margin increased by 240 bps over Q3 FY07


                                                                                                 10
Key Financial Value Drivers
Balance sheet management
    – Days of inventory on hand declined from 29 to 27 days Q3 FY08 vs. Q3 FY07
    – Portfolio optimization process continues
    – Non-GAAP ROIC up 5 bps vs. Q3 of prior year

Capital deployment
    – $150M in share buyback completed in Q3, $1.1B repurchased during the 1st
      nine months of FY08

Capital structure
    – Debt to total capital increased from 29% in Q3 FY07 to 34% in Q3 FY08
    – Net debt to capital1 increased to 24% vs. 21% in Q3 last year


       Non-GAAP Return on Equity increased 40 bps to 21.3%
                                                                1Non-GAAP   financial measure


                                                                                        11
FY08 Outlook
Expect to achieve right about the mid-point of non-GAAP EPS guidance of
$3.75 – $3.85, excluding $0.01 - $0.02 dilutive impact of Enturia.
In Q4, continued Supply Chain Pharma (HSCS-P) challenges positively
balanced with HSCS-M, CTS and MPT performance:
                 Challenges from repricings and controlled substance anti-diversion
   HSCS – P      efforts. Slower pharma market growth.


                 Turnaround continues with solid performance.
  HSCS – M


                 Continued strong performance. Q4 is tough compare due to exceptional
     CTS         Q4 FY07 performance.


                 Growth driven by VIASYS and core business. Enturia acquisition will be
     MPT
                 1-2¢ dilutive in Q4, accretive in FY2009.


                                                                                      12
Financial Goals
        FY08 Guidance - May 1, 2008
Revenue: approximately 5%


Non-GAAP EPS1: about mid-point of
$3.75 - $3.85 per share, excluding $0.01 -
$0.02 dilutive impact of Enturia

FY09 guidance part of Q4 FY08 earnings
release/conference call in August


              1 Non-GAAP diluted EPS from continuing operations
                                                                  13
Q&A
cardinal health Q3 2008 Earnings Presentation
Healthcare Supply Chain Services
Business Analysis
Healthcare Supply Chain Services – Pharmaceutical
               Q3FY07    Q4FY07    Q1FY08   Q2FY08    Q3FY08    Q3FY08/
                                                                Q3FY07
                                                                % change
Revenue        $19,246   $19,556   19,221   $20,351   $19,894   3%
($M)
Segment        $380      $303      $305     $258      $300      -21%
Profit ($M)


Healthcare Supply Chain Services – Medical
               Q3FY07    Q4FY07    Q1FY08   Q2FY08    Q3FY08    Q3FY08/
                                                                Q3FY07
                                                                % change
 Revenue       $1,907    $1,929    $1,921   $2,015    $2,066    8%
 ($M)
 Segment       $89       $83       $58      $72       $93       5%
 Profit ($M)


                                                                           16
Clinical and Medical Products
Business Analysis
Medical Products and Technologies
              Q3FY07   Q4FY07   Q1FY08   Q2FY08   Q3FY08   Q3FY08/
                                                           Q3FY07
                                                           % change
Revenue       $458     $500     $623     $667     $679     48%
($M)
Segment       $47      $58      $57      $69      $80      72%
Profit ($M)


Clinical Technologies and Services
              Q3FY07   Q4FY07   Q1FY08   Q2FY08   Q3FY08   Q3FY08/
                                                           Q3FY07
                                                           % change
Revenue       $674     $756     $649     $715     $747     11%
($M)
Segment       $98      $144     $98      $115     $127     29%
Profit ($M)


                                                                      17
cardinal health Q3 2008 Earnings Presentation

More Related Content

cardinal health Q3 2008 Earnings Presentation

  • 1. Q3 FY 2008 Earnings Call FY 2008 Essential to care May 1, 2008
  • 2. Forward-looking statements and GAAP reconciliation This presentation contains forward-looking statements addressing expectations, prospects, estimates and other matters that are dependent upon future events or developments. These matters are subject to risks and uncertainties that could cause actual results to differ materially from those projected, anticipated or implied. The most significant of these uncertainties are described in Cardinal Health's Form 10-K, Form 10-Q and Form 8-K reports (including all amendments to those reports) and exhibits to those reports, and include (but are not limited to) the following: competitive pressures in Cardinal Health's various lines of business; the loss of one or more key customer or supplier relationships or changes to the terms of those relationships; uncertainties relating to the timing of generic or branded pharmaceutical introductions and the frequency or rate of branded pharmaceutical price appreciation or generic pharmaceutical price deflation; changes in the distribution patterns or reimbursement rates for healthcare products and/or services; the results, consequences, effects or timing of any inquiry or investigation by any regulatory authority or any legal or administrative proceedings; future actions of regulatory bodies or government authorities relating to Cardinal Health's manufacturing or sale of products and other costs or claims that could arise from its manufacturing, compounding or repackaging operations or from its other services; the costs, difficulties and uncertainties related to the integration of acquired businesses; uncertainties relating to the amount of future share repurchases by Cardinal Health, which can be affected by Cardinal Health's then-current stock price, regulatory restraints on share repurchases, cash flows, financial condition and alternative uses of cash available to Cardinal Health at the time, as well as by the amount of any additional share repurchases authorized by the board of directors; conditions in the pharmaceutical market and general economic and market conditions. This presentation reflects management’s views as of May 1, 2008. Except to the extent required by applicable law, Cardinal Health undertakes no obligation to update or revise any forward- looking statement. In addition, this presentation includes non-GAAP financial measures. Cardinal Health provides definitions and reconciling information at the end of this presentation and on its investor relations page at www.cardinalhealth.com. 2
  • 3. Agenda Opening remarks Kerry Clark Chairman and Chief Executive Officer Financial overview Jeff Henderson Chief Financial Officer HSCS-P Comments George Barrett Vice Chairman and CEO Healthcare Supply Chain Services Q&A Kerry Clark Jeff Henderson George Barrett Dave Schlotterbeck Vice Chairman and CEO Clinical and Medical Products 3
  • 4. Financial Overview • FY 2008 Q3 Results – Consolidated • FY 2008 Q3 Results – Business Segments • Key Financial Value Drivers • FY 2008 Q4 and Full Year Financial Targets and Comments 4
  • 5. Q3 FY 2008 Recap GAAP Basis Non-GAAP Basis % % Change1 Change1 ($M) ($M) $22,910 5% Revenue n.m2 $577 $613 1% Operating earnings n.m2 $366 $390 - Earnings from continuing ops n.m2 $1.02 $1.08 13% Diluted EPS from continuing ops $897 Operating cash flow 19.6% 21.3% Return on equity 1% change over prior year quarter 2Prior year negative 5
  • 6. Q3 Operating Earnings and EPS Q3 FY 2008 Q3 FY 2007 Operating Diluted EPS from Operating Diluted EPS from Earnings/(Loss) Continuing Earnings/(Loss) Continuing ($M) Operations ($M) Operations GAAP Consolidated $577 $1.02 ($10) ($0.01) Special Items $36 $0.06 $612 $0.96 Impairment Charges & Other $1 $0.00 $4 $0.01 Non-GAAP Consolidated $613 $1.08 $606 $0.96 6
  • 7. Healthcare Supply Chain Services – Pharmaceutical Business Analysis Q3 FY08 Q3 FY07 ($M) ($M) % Change Revenue 19,894 19,246 3% Segment Profit 300 380 (21%) Highlights: • Revenue up 3% on increased sales to existing bulk customers • Segment profit down 21%, driven by customer repricings, controlled substance anti-diversion impact and negative comparison to DSA benefit of $15.8M in Q3 FY07 (earned in CY06) • Tangible capital improved 1%1 reflecting continued focus on capital efficiency; days inventory on hand improved by 2 days versus prior year 1Non-GAAP financial measure 7
  • 8. Healthcare Supply Chain Services – Medical Business Analysis Q3 FY08 Q3 FY07 ($M) ($M) % Change Revenue 2,066 1,907 8% Segment Profit 93 89 5% Highlights: • Revenue up 8% on increased penetration and sales to existing hospital, laboratory, and ambulatory customers • Segment profit up 5%, driven by sales volume increase, partially offset by the previously disclosed change in corporate allocation, and continued softness in the surgical kitting business • Corporate allocation change negatively impacted segment profit by approximately 6 pps • Tangible capital improved 4%1 1Non-GAAP financial measure 8
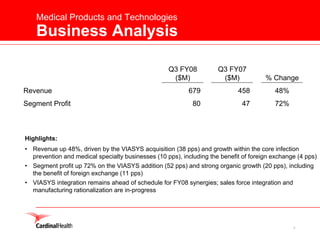
  • 9. Medical Products and Technologies Business Analysis Q3 FY08 Q3 FY07 ($M) ($M) % Change Revenue 679 458 48% Segment Profit 80 47 72% Highlights: • Revenue up 48%, driven by the VIASYS acquisition (38 pps) and growth within the core infection prevention and medical specialty businesses (10 pps), including the benefit of foreign exchange (4 pps) • Segment profit up 72% on the VIASYS addition (52 pps) and strong organic growth (20 pps), including the benefit of foreign exchange (11 pps) • VIASYS integration remains ahead of schedule for FY08 synergies; sales force integration and manufacturing rationalization are in-progress 9
  • 10. Clinical Technologies and Services Business Analysis Q3 FY08 Q3 FY07 ($M) ($M) % Change Revenue 747 674 11% Segment Profit 127 98 29% Highlights: • Revenue up 11% over prior year on strong installation for Pyxis medication and supply dispensing products and Alaris infusion products, dampened in part by a slowdown in pharmacy services • Segment profit up 29%, driven by favorable product mix and improved operating leverage, partially offset by the $6.5M charge for the voluntary recall of integrated circuits and connecters on certain Alaris® System modules • Segment profit margin increased by 240 bps over Q3 FY07 10
  • 11. Key Financial Value Drivers Balance sheet management – Days of inventory on hand declined from 29 to 27 days Q3 FY08 vs. Q3 FY07 – Portfolio optimization process continues – Non-GAAP ROIC up 5 bps vs. Q3 of prior year Capital deployment – $150M in share buyback completed in Q3, $1.1B repurchased during the 1st nine months of FY08 Capital structure – Debt to total capital increased from 29% in Q3 FY07 to 34% in Q3 FY08 – Net debt to capital1 increased to 24% vs. 21% in Q3 last year Non-GAAP Return on Equity increased 40 bps to 21.3% 1Non-GAAP financial measure 11
  • 12. FY08 Outlook Expect to achieve right about the mid-point of non-GAAP EPS guidance of $3.75 – $3.85, excluding $0.01 - $0.02 dilutive impact of Enturia. In Q4, continued Supply Chain Pharma (HSCS-P) challenges positively balanced with HSCS-M, CTS and MPT performance: Challenges from repricings and controlled substance anti-diversion HSCS – P efforts. Slower pharma market growth. Turnaround continues with solid performance. HSCS – M Continued strong performance. Q4 is tough compare due to exceptional CTS Q4 FY07 performance. Growth driven by VIASYS and core business. Enturia acquisition will be MPT 1-2¢ dilutive in Q4, accretive in FY2009. 12
  • 13. Financial Goals FY08 Guidance - May 1, 2008 Revenue: approximately 5% Non-GAAP EPS1: about mid-point of $3.75 - $3.85 per share, excluding $0.01 - $0.02 dilutive impact of Enturia FY09 guidance part of Q4 FY08 earnings release/conference call in August 1 Non-GAAP diluted EPS from continuing operations 13
  • 14. Q&A
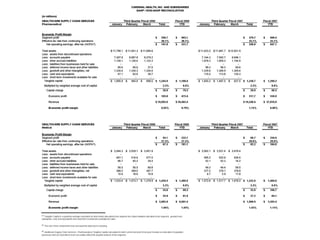
  • 16. Healthcare Supply Chain Services Business Analysis Healthcare Supply Chain Services – Pharmaceutical Q3FY07 Q4FY07 Q1FY08 Q2FY08 Q3FY08 Q3FY08/ Q3FY07 % change Revenue $19,246 $19,556 19,221 $20,351 $19,894 3% ($M) Segment $380 $303 $305 $258 $300 -21% Profit ($M) Healthcare Supply Chain Services – Medical Q3FY07 Q4FY07 Q1FY08 Q2FY08 Q3FY08 Q3FY08/ Q3FY07 % change Revenue $1,907 $1,929 $1,921 $2,015 $2,066 8% ($M) Segment $89 $83 $58 $72 $93 5% Profit ($M) 16
  • 17. Clinical and Medical Products Business Analysis Medical Products and Technologies Q3FY07 Q4FY07 Q1FY08 Q2FY08 Q3FY08 Q3FY08/ Q3FY07 % change Revenue $458 $500 $623 $667 $679 48% ($M) Segment $47 $58 $57 $69 $80 72% Profit ($M) Clinical Technologies and Services Q3FY07 Q4FY07 Q1FY08 Q2FY08 Q3FY08 Q3FY08/ Q3FY07 % change Revenue $674 $756 $649 $715 $747 11% ($M) Segment $98 $144 $98 $115 $127 29% Profit ($M) 17