Location via proxy:   [ UP ]  
[Report a bug]   [Manage cookies]                
SlideShare a Scribd company logo
2007

Fourth Quarter Earnings
Kerry Clark
Chief Executive Officer

Jeff Henderson
Chief Financial Officer

August 9, 2007
Forward-Looking Statements and GAAP Reconciliation

This presentation contains forward-looking statements addressing expectations, prospects, estimates and
other matters that are dependent upon future events or developments. These matters are subject to risks
and uncertainties that could cause actual results to differ materially from those projected, anticipated or
implied. The most significant of these uncertainties are described in Cardinal Health's Form 10-K, Form 10-
Q and Form 8-K reports (including all amendments to those reports) and exhibits to those reports, and
include (but are not limited to) the following: competitive pressures in its various lines of business; the loss
of one or more key customer or supplier relationships or changes to the terms of those relationships;
uncertainties relating to the timing of generic introductions and the frequency or rate of pharmaceutical
price appreciation; changes in the distribution patterns or reimbursement rates for health-care products
and/or services; the results, consequences, effects or timing of any inquiry or investigation by any
regulatory authority or any legal and administrative proceedings; uncertainties related to finalizing the
pending settlement of the class-action securities litigation, including obtaining court approval of the
settlement; successful integration of Cardinal Health and VIASYS Healthcare and the ability to achieve
synergies from the acquisition; uncertainties relating to the amount of future share repurchases by Cardinal
Health, which can be affected by Cardinal Health's then-current stock price, regulatory restraints on share
repurchases, cash flows, financial condition and alternative uses of cash available to Cardinal Health at the
time, as well as by the amount of any additional share repurchases authorized by the board of directors;
and general economic and market conditions. This presentation reflects management’s views as of August
9, 2007. Except to the extent required by applicable law, Cardinal Health undertakes no obligation to
update or revise any forward-looking statement. In addition, this presentation includes non-GAAP financial
measures. Cardinal Health provides definitions and reconciling information at the end of this presentation
and on its investor relations page at www.cardinalhealth.com.


                                                                                                          2
Today’s Agenda

Opening remarks      Kerry Clark
                     Chief Executive
                     Officer

Financial overview   Jeff Henderson
                     Chief Financial
                     Officer

Q&A


                                       3
Fiscal 2007 Recap


•   FY07 has been a very good year, marked by a return to strong growth

•   Clinical and Medical Products sector emerged as a significant, value
    creating growth engine for entire company

•   Healthcare Supply Chain Services sector delivered strong FY07
    results
     – Good progress in Supply Chain Medical; return to target growth in latter
       part of FY08
     – Strong year for Supply Chain Pharma, despite Q4 comparability issue

•   Good momentum headed into FY08 with right business platform and
    team to deliver long-term growth goals


                                                                              4
Financial Overview

• FY 2007 Q4 Results – Consolidated
• FY 2007 Q4 Results – Segments
• FY 2007 Results - Consolidated
• FY 2007 Segment Scorecard
• Acquisition Scorecard
• FY 2008 Financial Targets and Goals


                                        5
Q4 Fiscal 2007 Financial Review

                                            GAAP Basis         Non-GAAP Basis
                                                       %                   %
                                                     Change1             Change1
                                           ($M)                 ($M)
Revenue                                    $22,263      5%

Operating earnings                           $421     (14%)      $538      3%

Earnings from continuing ops.                $238     (22%)      $345      5%

Diluted EPS from continuing ops.             $0.61    (15%)      $0.89    14%


Operating cash flow                         ($292)

Return on equity                            47.3%               17.3%
        % change over prior year quarter
        1


                                                                             6
Operating Earnings and EPS
         Q407 Operating Earnings and EPS

                                 Q4 FY 2007                           Q4 FY 2006
                       Operating       Diluted EPS from      Operating      Diluted EPS from
                     Earnings/(Loss)       Continuing     Earnings/(Loss)       Continuing
                          ($M)             Operations          ($M)             Operations


GAAP Consolidated        $421               $0.61             $487               $0.72


Special Items            $118               $0.28              $33               $0.06
Impairment Charges
& Other                   ($1)              $0.00              $1                $0.00
Non-GAAP
Consolidated             $538               $0.89             $521               $0.78


                                                                                         7
Q407 Business Analysis
 Healthcare Supply Chain Services - Pharmaceutical

                                                   Q4 FY07           Q4 FY06              %
                                                    ($M)              ($M)              Change
Revenue                                               19,556            18,752            4%
Segment Profit                                            303               312          (3%)


Highlights:
• Q4 revenue up 4% with core pharmaceutical distribution DSD revenue up 7% and bulk revenue up 4%
• Key factors impacting revenue growth included: branded to generic conversions, the lapping of large
  new bulk business obtained in Q406, and the sale of specialty business to OTN
• Q4 profit growth impacted by previously discussed year over year compare
• Economic profit margin1 decreased 1 basis point vs. prior year to 0.78%
• Q4 ’07 equity compensation expense of $11.1 million vs. $15.9 million in prior year
    Non-GAAP financial measure
    1


                                                                                                8
Q407 Business Analysis
 Healthcare Supply Chain Services - Medical

                                                   Q4 FY07           Q4 FY06            %
                                                    ($M)              ($M)            Change
Revenue                                                 1,929             1,837         5%
Segment Profit                                              83                85       (2%)


Highlights:
• Q4 revenue up 5%, supported by strong growth from lab and ambulatory customers and Canadian
  operations
• Segment profit impacted by operational investments (e.g., customer service) and a $7M increase
  over Q4 ’06 in customer-related write-offs
• Economic profit margin1 decreased 14 basis points vs. prior year to 1.36%
• Q4 ’07 equity compensation expense of $6.6 million vs. $9.1 million in prior year
    Non-GAAP financial measure
    1


                                                                                              9
Q407 Business Analysis
 Medical Products Manufacturing

                                                   Q4 FY07           Q4 FY06            %
                                                    ($M)              ($M)            Change
Revenue                                                    500               440         14%
Segment Profit                                              58                46         27%


Highlights:
• Q4 revenue up 14%; driven by strong growth across most businesses, new product launches and
  acquisitions
• Profit up 27% on strong top line growth in core business and expanding gross margins
• Viasys acquisition had a positive 3pp impact on revenue and negligible impact on segment profit
• Q4 ’07 equity compensation expense of $6.3 million vs. $8.1 million in prior year


                                                                                               10
Q407 Business Analysis
 Clinical Technologies and Services

                                                  Q4 FY07           Q4 FY06             %
                                                   ($M)              ($M)             Change
Revenue                                                   756              649           17%
Segment Profit                                            144                96          50%


Highlights:
• Revenue up on strong and growing demand for Alaris and Pyxis products, new product launches and
  improved installation cycles
• Q4 profit growth driven by higher volumes across all business lines, improved mix, impact of
  operational excellence initiatives, and improved operating leverage
• Q4 ’07 equity compensation expense of $8.7 million vs. $12.2 million in prior year


                                                                                                 11
Full Year FY07 Financial Review

                                            GAAP Basis         Non-GAAP Basis
                                                       %                   %
                                                     Change1             Change1
                                           ($M)                 ($M)
Revenue                                    $86,852      9%

Operating earnings                          $1,374    (26%)     $2,163    12%

Earnings from continuing ops.                $840     (28%)     $1,384    13%

Diluted EPS from continuing ops.             $2.07    (24%)      $3.42    20%


Operating cash flow                         $1,003

Return on equity                            23.5%               16.9%
        % change over prior year quarter
        1


                                                                             12
Operating Earnings and EPSand EPS
         Full Year FY07 Operating Earnings

                                  FY 2007                              FY 2006
                       Operating       Diluted EPS from     Operating       Diluted EPS from
                     Earnings/(Loss)       Continuing     Earnings/(Loss)       Continuing
                          ($M)             Operations          ($M)             Operations


GAAP Consolidated       $1,374              $2.07            $1,845              $2.71


Special Items            $772               $1.31              $81               $0.14
Impairment Charges
& Other                   $17               $0.04              $6                $0.01
Non-GAAP
Consolidated            $2,163              $3.42            $1,931              $2.86


Non-Recurring &
Other Items                                                    $26               $0.04


                                                                                         13
FY07 Scorecard
  Cardinal had a strong fiscal 2007 with three of four segments delivering
  outstanding performance
                     Revenue       Profit                 Performance vs.
                      Growth      Growth                Profit Growth Target

HSCS – Pharma           9%         14%                   Well Above Range


HSCS – Medical          4%          1%                   Below Range


Medical Products       12%         20%                   Well Above Range


Clinical
Technologies           11%         20%                   Top of Range


                                                                        14
Acquisition Scorecard

Acquisition                   Date                  Results
VIASYS Healthcare (MPM)      June ’07                         (+)
Specialty Scripts (HSCS-P)   January ’07                      (+)
Care Fusion (CTS)            October ’06                      (+)
MedMined (CTS)               July ’06                         (+)
Dohmen (HSCS-P)              June ’06                         (+)
Denver Biomedical (MPM)      May ’06                          (+)
Parmed (HSCS-P)              March ’06                        (+)
Source Medical (HSCS-M)      November ’05                     (+)
Geodax (HSCS-P)              July ’04                         (+)
Alaris (CTS)                 June ’04                         (+)
Snowden Pencer (MPM)         March ’04                        (–)

                                            Added since last update

                                                                      15
FY 2008 Financial Targets & Goals
                                                                                    As of Aug 9, 2007
             Long-Term Financial Goals                                                                                                            One Year Targets
             Over FY'08 - FY'10 3 Year Period:                                                                                                        Fiscal Year 2008
Revenue:                           + 8 - 10%                                 In range
                     1
Op Earnings :                      + 10 - 13%                                At or above top end of range
         2                                                                                                                          3
EPS :                              + 12 - 16%                                Above range ($3.95 - $4.15 per share )
                                                           Segment            FY08 profit growth
Segment                               Revenue               Profit            vs. long-term goal Drivers
                                                                                                      4       * Strong organic growth plus impact of tuck-ins; Stable to increasing segment profit margins
HSCS - Pharma                         + 7 - 10%            + 7 - 10%         Top end of range
                                                                                                                driven by vendor margins and expense controls; Stable to increasing EP margins
                                                                                                                driven by efficient capital usage (e.g., inventory)
                                                                                                              * Impact of recent large customer repricings
                                                                                                              * Impact of refined methodology for allocating corporate costs

                                                                                                4
                                                                                                              * Strong revenue growth in Lab and Ambulatory; Acute growth due to IPS, innovation and
HSCS - Medical                         + 4 - 7%             + 6 - 9%         Below range
                                                                                                                  improved order to cash process; Expecting second half turnaround
                                                                                                              * Continued investment in customer service and innovation; Impact of HSCS transition
                                                                                                              * Impact of refined methodology for allocating corporate costs

MPM                                   + 8 - 12%           + 25 - 30%         Above range                      * Revenue will well exceed range in FY08 due to Viasys impact
                                                                                                              * New customer contracts and penetration of existing customers; Product innovation;
                                                                                                                International growth; Positive impact of restructuring and sourcing initiatives; Impact of
                                                                                                                Viasys acquisition and DBI synergies

                                                                                                              * Strong demand for Alaris and Pyxis products; Strong international growth; Profit margin
CTS                                  + 10 - 15%           + 20 - 25%         In range
                                                                                                                expansion due to sales mix and expense controls; Benefits from CareFusion and
                                                                                                                MedMined acquisitions; SE recall charges in FY07
                                                                                                              * Continued investment in innovation, quality and customer service
                          5
Return on Equity :                 15% - 20%                                 In line with long-term goal
Operating Cash Flow: > 100% of net earnings                                  In line with long-term goal

Cash Returned                      up to 50% of OCF, via share - Quarterly dividend $0.12 per share
to Shareholders:                   repurchase and dividends    - PTS net proceeds utilized for incremental share repurchase

Credit Rating:                     Strong investment grade                   In-line
1
    Non-GAAP operating earnings
2
    Non-GAAP diluted EPS from continuing operations
3
    Includes impact of Viasys acquisition (up to $0.10 dilutive), continuing operations impact of PTS divestiture (e.g., share repo f rom proceeds) of approximately $0.40 (>$0.30 net year on year impact vs. FY07), and interest

                                                                                                                                                                                                                                     16
expense impact of SEC/litigation settlements
4
    Ref ined methodology f or allocation of corporate costs w ithin HSCS in FY08 positively impacts HSCS-P prof it grow th by 1.8 percentage points, and negatively impacts HSCS-M prof it grow th by 7.3 percentage points
5
    Non-GAAP return on equity
Other FY08 Assumptions

•   $4.1B in planned share buyback complete as of July; $2B in additional core share
    repurchase approved over the next two years

•   Assuming approximately 375M average shares outstanding for FY08

•   Interest / other forecast in range of $220M to $235M
     –   SEC and related litigation settlements to impact EPS by approximately $0.05 per share


•   Non-GAAP effective tax rate for FY08 expected to be in the range of 31.75% to
    32.00%

•   Refined methodology for allocating corporate costs in FY08
     –   Positively impacts HSCS – Pharma earnings growth by ~1.8 percentage points
     –   Negatively impacts HSCS – Medical earning growth by ~7.3 percentage points


                                                                                             17
Q&A

      18
cardinal health Q4 2007 Earnings Presentation

More Related Content

cardinal health Q4 2007 Earnings Presentation

  • 1. 2007 Fourth Quarter Earnings Kerry Clark Chief Executive Officer Jeff Henderson Chief Financial Officer August 9, 2007
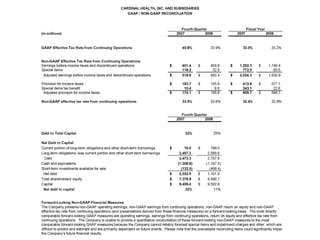
  • 2. Forward-Looking Statements and GAAP Reconciliation This presentation contains forward-looking statements addressing expectations, prospects, estimates and other matters that are dependent upon future events or developments. These matters are subject to risks and uncertainties that could cause actual results to differ materially from those projected, anticipated or implied. The most significant of these uncertainties are described in Cardinal Health's Form 10-K, Form 10- Q and Form 8-K reports (including all amendments to those reports) and exhibits to those reports, and include (but are not limited to) the following: competitive pressures in its various lines of business; the loss of one or more key customer or supplier relationships or changes to the terms of those relationships; uncertainties relating to the timing of generic introductions and the frequency or rate of pharmaceutical price appreciation; changes in the distribution patterns or reimbursement rates for health-care products and/or services; the results, consequences, effects or timing of any inquiry or investigation by any regulatory authority or any legal and administrative proceedings; uncertainties related to finalizing the pending settlement of the class-action securities litigation, including obtaining court approval of the settlement; successful integration of Cardinal Health and VIASYS Healthcare and the ability to achieve synergies from the acquisition; uncertainties relating to the amount of future share repurchases by Cardinal Health, which can be affected by Cardinal Health's then-current stock price, regulatory restraints on share repurchases, cash flows, financial condition and alternative uses of cash available to Cardinal Health at the time, as well as by the amount of any additional share repurchases authorized by the board of directors; and general economic and market conditions. This presentation reflects management’s views as of August 9, 2007. Except to the extent required by applicable law, Cardinal Health undertakes no obligation to update or revise any forward-looking statement. In addition, this presentation includes non-GAAP financial measures. Cardinal Health provides definitions and reconciling information at the end of this presentation and on its investor relations page at www.cardinalhealth.com. 2
  • 3. Today’s Agenda Opening remarks Kerry Clark Chief Executive Officer Financial overview Jeff Henderson Chief Financial Officer Q&A 3
  • 4. Fiscal 2007 Recap • FY07 has been a very good year, marked by a return to strong growth • Clinical and Medical Products sector emerged as a significant, value creating growth engine for entire company • Healthcare Supply Chain Services sector delivered strong FY07 results – Good progress in Supply Chain Medical; return to target growth in latter part of FY08 – Strong year for Supply Chain Pharma, despite Q4 comparability issue • Good momentum headed into FY08 with right business platform and team to deliver long-term growth goals 4
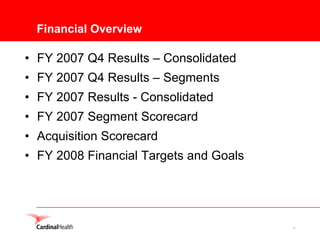
  • 5. Financial Overview • FY 2007 Q4 Results – Consolidated • FY 2007 Q4 Results – Segments • FY 2007 Results - Consolidated • FY 2007 Segment Scorecard • Acquisition Scorecard • FY 2008 Financial Targets and Goals 5
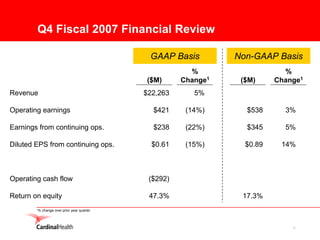
  • 6. Q4 Fiscal 2007 Financial Review GAAP Basis Non-GAAP Basis % % Change1 Change1 ($M) ($M) Revenue $22,263 5% Operating earnings $421 (14%) $538 3% Earnings from continuing ops. $238 (22%) $345 5% Diluted EPS from continuing ops. $0.61 (15%) $0.89 14% Operating cash flow ($292) Return on equity 47.3% 17.3% % change over prior year quarter 1 6
  • 7. Operating Earnings and EPS Q407 Operating Earnings and EPS Q4 FY 2007 Q4 FY 2006 Operating Diluted EPS from Operating Diluted EPS from Earnings/(Loss) Continuing Earnings/(Loss) Continuing ($M) Operations ($M) Operations GAAP Consolidated $421 $0.61 $487 $0.72 Special Items $118 $0.28 $33 $0.06 Impairment Charges & Other ($1) $0.00 $1 $0.00 Non-GAAP Consolidated $538 $0.89 $521 $0.78 7
  • 8. Q407 Business Analysis Healthcare Supply Chain Services - Pharmaceutical Q4 FY07 Q4 FY06 % ($M) ($M) Change Revenue 19,556 18,752 4% Segment Profit 303 312 (3%) Highlights: • Q4 revenue up 4% with core pharmaceutical distribution DSD revenue up 7% and bulk revenue up 4% • Key factors impacting revenue growth included: branded to generic conversions, the lapping of large new bulk business obtained in Q406, and the sale of specialty business to OTN • Q4 profit growth impacted by previously discussed year over year compare • Economic profit margin1 decreased 1 basis point vs. prior year to 0.78% • Q4 ’07 equity compensation expense of $11.1 million vs. $15.9 million in prior year Non-GAAP financial measure 1 8
  • 9. Q407 Business Analysis Healthcare Supply Chain Services - Medical Q4 FY07 Q4 FY06 % ($M) ($M) Change Revenue 1,929 1,837 5% Segment Profit 83 85 (2%) Highlights: • Q4 revenue up 5%, supported by strong growth from lab and ambulatory customers and Canadian operations • Segment profit impacted by operational investments (e.g., customer service) and a $7M increase over Q4 ’06 in customer-related write-offs • Economic profit margin1 decreased 14 basis points vs. prior year to 1.36% • Q4 ’07 equity compensation expense of $6.6 million vs. $9.1 million in prior year Non-GAAP financial measure 1 9
  • 10. Q407 Business Analysis Medical Products Manufacturing Q4 FY07 Q4 FY06 % ($M) ($M) Change Revenue 500 440 14% Segment Profit 58 46 27% Highlights: • Q4 revenue up 14%; driven by strong growth across most businesses, new product launches and acquisitions • Profit up 27% on strong top line growth in core business and expanding gross margins • Viasys acquisition had a positive 3pp impact on revenue and negligible impact on segment profit • Q4 ’07 equity compensation expense of $6.3 million vs. $8.1 million in prior year 10
  • 11. Q407 Business Analysis Clinical Technologies and Services Q4 FY07 Q4 FY06 % ($M) ($M) Change Revenue 756 649 17% Segment Profit 144 96 50% Highlights: • Revenue up on strong and growing demand for Alaris and Pyxis products, new product launches and improved installation cycles • Q4 profit growth driven by higher volumes across all business lines, improved mix, impact of operational excellence initiatives, and improved operating leverage • Q4 ’07 equity compensation expense of $8.7 million vs. $12.2 million in prior year 11
  • 12. Full Year FY07 Financial Review GAAP Basis Non-GAAP Basis % % Change1 Change1 ($M) ($M) Revenue $86,852 9% Operating earnings $1,374 (26%) $2,163 12% Earnings from continuing ops. $840 (28%) $1,384 13% Diluted EPS from continuing ops. $2.07 (24%) $3.42 20% Operating cash flow $1,003 Return on equity 23.5% 16.9% % change over prior year quarter 1 12
  • 13. Operating Earnings and EPSand EPS Full Year FY07 Operating Earnings FY 2007 FY 2006 Operating Diluted EPS from Operating Diluted EPS from Earnings/(Loss) Continuing Earnings/(Loss) Continuing ($M) Operations ($M) Operations GAAP Consolidated $1,374 $2.07 $1,845 $2.71 Special Items $772 $1.31 $81 $0.14 Impairment Charges & Other $17 $0.04 $6 $0.01 Non-GAAP Consolidated $2,163 $3.42 $1,931 $2.86 Non-Recurring & Other Items $26 $0.04 13
  • 14. FY07 Scorecard Cardinal had a strong fiscal 2007 with three of four segments delivering outstanding performance Revenue Profit Performance vs. Growth Growth Profit Growth Target HSCS – Pharma 9% 14% Well Above Range HSCS – Medical 4% 1% Below Range Medical Products 12% 20% Well Above Range Clinical Technologies 11% 20% Top of Range 14
  • 15. Acquisition Scorecard Acquisition Date Results VIASYS Healthcare (MPM) June ’07 (+) Specialty Scripts (HSCS-P) January ’07 (+) Care Fusion (CTS) October ’06 (+) MedMined (CTS) July ’06 (+) Dohmen (HSCS-P) June ’06 (+) Denver Biomedical (MPM) May ’06 (+) Parmed (HSCS-P) March ’06 (+) Source Medical (HSCS-M) November ’05 (+) Geodax (HSCS-P) July ’04 (+) Alaris (CTS) June ’04 (+) Snowden Pencer (MPM) March ’04 (–) Added since last update 15
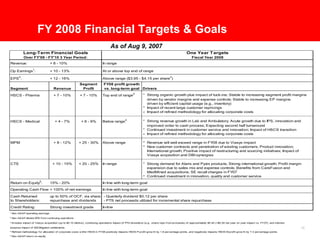
  • 16. FY 2008 Financial Targets & Goals As of Aug 9, 2007 Long-Term Financial Goals One Year Targets Over FY'08 - FY'10 3 Year Period: Fiscal Year 2008 Revenue: + 8 - 10% In range 1 Op Earnings : + 10 - 13% At or above top end of range 2 3 EPS : + 12 - 16% Above range ($3.95 - $4.15 per share ) Segment FY08 profit growth Segment Revenue Profit vs. long-term goal Drivers 4 * Strong organic growth plus impact of tuck-ins; Stable to increasing segment profit margins HSCS - Pharma + 7 - 10% + 7 - 10% Top end of range driven by vendor margins and expense controls; Stable to increasing EP margins driven by efficient capital usage (e.g., inventory) * Impact of recent large customer repricings * Impact of refined methodology for allocating corporate costs 4 * Strong revenue growth in Lab and Ambulatory; Acute growth due to IPS, innovation and HSCS - Medical + 4 - 7% + 6 - 9% Below range improved order to cash process; Expecting second half turnaround * Continued investment in customer service and innovation; Impact of HSCS transition * Impact of refined methodology for allocating corporate costs MPM + 8 - 12% + 25 - 30% Above range * Revenue will well exceed range in FY08 due to Viasys impact * New customer contracts and penetration of existing customers; Product innovation; International growth; Positive impact of restructuring and sourcing initiatives; Impact of Viasys acquisition and DBI synergies * Strong demand for Alaris and Pyxis products; Strong international growth; Profit margin CTS + 10 - 15% + 20 - 25% In range expansion due to sales mix and expense controls; Benefits from CareFusion and MedMined acquisitions; SE recall charges in FY07 * Continued investment in innovation, quality and customer service 5 Return on Equity : 15% - 20% In line with long-term goal Operating Cash Flow: > 100% of net earnings In line with long-term goal Cash Returned up to 50% of OCF, via share - Quarterly dividend $0.12 per share to Shareholders: repurchase and dividends - PTS net proceeds utilized for incremental share repurchase Credit Rating: Strong investment grade In-line 1 Non-GAAP operating earnings 2 Non-GAAP diluted EPS from continuing operations 3 Includes impact of Viasys acquisition (up to $0.10 dilutive), continuing operations impact of PTS divestiture (e.g., share repo f rom proceeds) of approximately $0.40 (>$0.30 net year on year impact vs. FY07), and interest 16 expense impact of SEC/litigation settlements 4 Ref ined methodology f or allocation of corporate costs w ithin HSCS in FY08 positively impacts HSCS-P prof it grow th by 1.8 percentage points, and negatively impacts HSCS-M prof it grow th by 7.3 percentage points 5 Non-GAAP return on equity
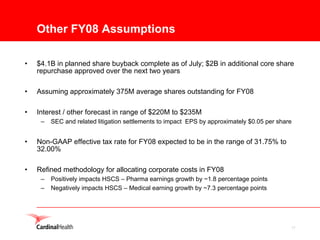
  • 17. Other FY08 Assumptions • $4.1B in planned share buyback complete as of July; $2B in additional core share repurchase approved over the next two years • Assuming approximately 375M average shares outstanding for FY08 • Interest / other forecast in range of $220M to $235M – SEC and related litigation settlements to impact EPS by approximately $0.05 per share • Non-GAAP effective tax rate for FY08 expected to be in the range of 31.75% to 32.00% • Refined methodology for allocating corporate costs in FY08 – Positively impacts HSCS – Pharma earnings growth by ~1.8 percentage points – Negatively impacts HSCS – Medical earning growth by ~7.3 percentage points 17
  • 18. Q&A 18