Clean Energy Ministerial - Digital Media Year+ in Review
- 1. CLEAN ENERGY MINISTERIAL DIGITAL MEDIA Performance Review & Recommendations Highlights Feb. 2013 through May 2014
- 2. 2 SUPPORTING CEM COMMUNICATIONS GOALS CEM communications strive to raise the public profile of the CEM and its achievements. Increased recognition can help drive greater government support and engagement, and broaden CEM’s impact. To meet these goals, CEM’s communications strategy includes media relations, events, positioning, and stakeholder outreach activities. CEM’s digital media platforms support the stakeholder outreach component of the strategy, supporting direct outreach to stakeholders in key target audiences.
- 3. 3 OUTREACH OBJECTIVES The objectives of stakeholder outreach include: • Communicating clear and concrete achievements of CEM and initiatives • Informing the ‘engaged’ public of the contributions of CEM and the individual initiatives towards transitioning to a clean energy economy • Providing convincing evidence to industry and technical leaders of the validity and potential and actual impact of CEM initiatives • Increasing the utilization of initiative resources and positive impact from initiative products and services • Using storytelling to more effectively engage with all constituencies, but particularly with the public and other non-technical stakeholders.
- 4. 4 ACTIVITIES AND TARGET OUTCOMES Activities Twitter Facebook LinkedIn YouTube Newsletter Website Audiences Public CEM governments Policymakers in CEM countries Energy NGOs Climate change constituencies Private sector/industry Outcomes Increased awareness of CEM & its work Increased exposure for CEM information & tools Sustained, year- round discussion about CEM & its work Increased use of CEM information & tools
- 5. 5 MEASURING PROGRESS Outcome How can we measure progress in this area? Exposure for CEM information & tools Metrics that address the size and scope of your audience: Followers, impressions, views/opens, extent to which you are reaching target audiences & target countries Awareness of CEM & its work Metrics that address user interest in your content: Likes, shares Discussion about CEM & its work Metrics that address conversation: Replies, comments, mentions of CEM, LinkedIn discussions Use of CEM information & tools Metrics that address content use: Downloads, clicks, video views, page views
- 6. 6 THE TRENDS Twitter: High growth and interaction • Fastest growth (994 followers); highest exposure (3,000,000+ impressions); highest shares; highest level of discussion Facebook: Growing platform for public outreach and interaction • Our top platform for shares and for outreach to the public LinkedIn: A growth opportunity • This group could be a strong platform to build discussion with U.S.-based energy sector professionals. YouTube: An enabling foundation • Provides an online archive for our videos, which makes it easier to use them as part of our social media content
- 7. 7 THE TRENDS E-newsletter: • Our best platform for outreach to CEM government delegations, with strong user response to our content CEM website: • Our best platform for exposure (views) and use (clicks on CEM tools and resources)
- 8. 8 TOP PLATFORM FOR FOLLOWER GROWTH Twitter has our fastest-growing fan base. 0 100 200 300 400 500 600 700 800 900 1000 1/26/2013 3/17/2013 5/6/2013 6/25/2013 8/14/2013 10/3/2013 11/22/2013 1/11/2014 3/2/2014 4/21/2014 6/10/2014 Twitter Followers Facebook Fans LinkedIn Members
- 9. 9 TOP PLATFORM FOR IMPRESSIONS We have gained over 3 million total impressions (potential views) on twitter, the highest among our social media platforms. And monthly impressions have risen sharply in 2014. 0 100000 200000 300000 400000 500000 600000 700000 800000 Impressions per Month
- 10. 10 CONNECTING WITH TARGET AUDIENCES On twitter, a mix of organizations (below) & individuals – including big players like the IEA & UNFCCC – have retweeted our content or mentioned us.
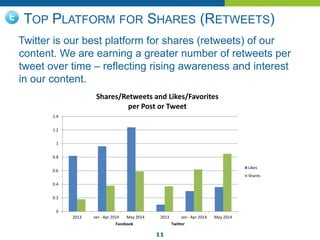
- 11. 11 TOP PLATFORM FOR SHARES (RETWEETS) Twitter is our best platform for shares (retweets) of our content. We are earning a greater number of retweets per tweet over time – reflecting rising awareness and interest in our content. 0 0.2 0.4 0.6 0.8 1 1.2 1.4 2013 Jan - Apr 2014 May 2014 2013 Jan - Apr 2014 May 2014 Facebook Twitter Shares/Retweets and Likes/Favorites per Post or Tweet Likes Shares
- 12. 12 TOP PLATFORM FOR DISCUSSION Our fans are using twitter to interact with us in many ways: To respond to our comments To discuss our content, within their network To draw our attention to something To promote/discuss our events To ask questions To add commentary on our tweets
- 13. 13 TOP PLATFORM FOR ENGAGING WITH THE PUBLIC Facebook is our top platform for informing and interacting with the public. Among 100 different accounts that have liked/shared our content, about 80% are individuals – members of the energy-interested public. The other 20% are organizations, including some from CEM target audiences: • Energy NGOs: CLASP, IPEEC, Buildings Performance Institute – Europe, Light Up the World, National Green Energy Council • Industry groups: Expo Biomasa, AVEBiom • Climate constituencies: UNFCCC
- 14. 14 TOP PLATFORM FOR LIKES 0 0.2 0.4 0.6 0.8 1 1.2 1.4 2013 Jan - Apr 2014 May 2014 2013 Jan - Apr 2014 May 2014 Facebook Twitter Likes Shares 0 20 40 60 80 100 120 Feb-13 Mar-13 Apr-13 May-13 Jun-13 Jul-13 Aug-13 Sep-13 Oct-13 Nov-13 Dec-13 Jan-14 Feb-14 Mar-14 Apr-14 May-14 Likes Likes Facebook is our top platform for likes (thumbs up) on our content. The total number of likes per month has risen over time (left). The number of likes per post is also growing (right), reflecting rising awareness and interest in our content.
- 15. 15 MOST LIKED/SHARED FACEBOOK CONTENT Most liked on our page: Most shared on our page:
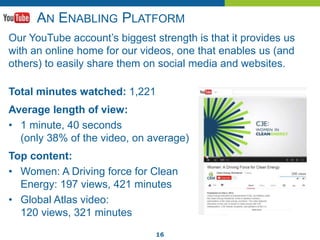
- 16. 16 AN ENABLING PLATFORM Our YouTube account’s biggest strength is that it provides us with an online home for our videos, one that enables us (and others) to easily share them on social media and websites. Total minutes watched: 1,221 Average length of view: • 1 minute, 40 seconds (only 38% of the video, on average) Top content: • Women: A Driving force for Clean Energy: 197 views, 421 minutes • Global Atlas video: 120 views, 321 minutes
- 17. 17 AN UNTAPPED OPPORTUNITY? Our LinkedIn group represents a large potential opportunity for outreach, especially in the U.S. energy sector. Members are primarily U.S. professionals – Johannesburg is the only international city in the list of top audience locations. 28% of group members say that they work in the energy sector.
- 18. 18 MEMBER-DIRECTED ACTIVITY Our LinkedIn group is self-directed – any group member can begin a discussion. This has enabled the CEM team to spend little time developing and managing the group – no more than 30-60 minutes per week. To date, discussions and replies are very low. But a more focused effort to market the group and build discussion could bring the group to life.
- 19. 19 TOP PLATFORM FOR GOVERNMENT OUTREACH Our e-newsletter is our best platform for outreach to CEM governments. A large share of the newsletter’s 2,817 subscribers are members of government delegations. The list includes a smaller percentage of industry members, NGOs, and the public.
- 20. 20 STRONG USER RESPONSE The e-newsletter audience is showing strong interest in and response to our newsletter content. Percentage who open the email: • 20%-25%, which is in line with industry averages Percentage who click: • 5%-8%, which is above industry averages 0% 5% 10% 15% 20% 25% 30% Spring 2013 Summer 2013 (Post CEM4) Fall 2013 Winter 2014 Spring 2014 Open and Click Rates for E-Newsletter % who opened % who clicked Industry avg. (government) Industry avg. (government)
- 21. 21 A STRONG SOURCE OF CLICKS TO WEBSITE The newsletter has earned 1,623 total clicks across 5 issues. The clicks are broad-based; every article and link receives at least a few clicks. Because the newsletter features CEM content almost exclusively, 99% of these clicks took users to the CEM website. Our most-clicked story: • CEM4 Outcomes: 71 clicks
- 22. 22 TOP PLATFORM FOR VIEWS The CEM website is the permanent online home of CEM news, tools, and other content. It is our top source of exposure (views), receiving 262,907 page views in this period. Most-viewed pages: • Home page: 37,669 views; 14.3% of total site page views • CEM4 page: 10,339 views; 3.9% of total • About: 9,694 views; 3.7% of total • CEM5 page: 6,113 views; 2.3% of total The number of page views is holding fairly steady in 2014, with a modest rise in May and June 2014.
- 23. 23 TOP PLATFORM FOR CLICKS Our website is also our top platform for clicks on CEM PDF documents and links to CEM-related websites. Clicks per month are rising, as more users access site tools and resources. Clicks on PDFs: • 16,467 total for the period Most-clicked PDFs: • CEM5 Key Results (80) • CEM5 Briefing Paper (46) • CEM5 Agenda (41) 0 500 1000 1500 2000 2500 3000 2013 Jan - Apr 2014 May-14 Average Clicks per Month Link Clicks PDF clicks Clicks on (non-PDF) links: • 11,828 total for the period Most-clicked links: • CEM participants’ portal (1,222) • World EV Cities Portal (387) • IREED.org (238)
- 24. 24 KEY CHALLENGES AND RECOMMENDATIONS Twitter: • Challenge: Growing discussion means there is a growing need to respond to comments and replies. • Recommendation: Develop a process for addressing and responding to replies and comments. Facebook: • Challenge. Limited exposure. Facebook’s page algorithm controls how many/few users see your content. • Recommendation: Focus on developing shareable content – which is actionable, positive, timely, and includes an image. Shares drive greater exposure. Share key content during the work week.
- 25. 25 KEY CHALLENGES AND RECOMMENDATIONS YouTube: • Challenge: Limited use. Views are declining, and users watch only about one-third (1.6 minutes) of a given video. • Recommendation: To encourage more views, give YouTube better visibility – promote it on our website, in our newsletter, and on our social media platforms. Also, ensure that future videos we add to the channel are short if possible – 2 minutes or less in length. LinkedIn: • Challenge: This self-directed group has little activity. • Recommendation: Develop a focused strategy for marketing the group (to add new members) and for stimulating & sustaining discussion.
- 26. 26 KEY CHALLENGES AND RECOMMENDATIONS E-newsletter: • Challenge: Clicks and opens have declined slightly, and our newsletter format has not been refreshed in over a year. • Recommendation: Assess the potential for a more-frequent publishing schedule and revamped newsletter format to drive more opens and clicks (by offering more timely content, more links to click, etc.). Website: • Challenge: Page views and site visits peaked in April 2013 (around CEM4) and then declined in May 2013. Visits and page views have held steady since that time. • Recommendation: Assess specific objectives for website efforts to grow site traffic and develop a focused strategy to market the website to meet those goals.
- 27. 27 FOR MORE INFORMATION More detailed performance analysis for each platform, including a detailed discussion of strengths, challenges, opportunities, and recommendations is included in the longer version of this presentation.
Editor's Notes
- CEM’s communications strategy features a wide range of PR, positioning, and event-focused communications activities, in addition to stakeholder outreach.
- Six digital media platforms provide a foundation for stakeholder outreach. Specific activities include: Publishing content & building discussion on Twitter Publishing content & building discussion on Facebook Maintaining a library of videos on YouTube Moderating a LinkedIn discussion group Designing, developing, & distributing a quarterly CEM e-newsletter Publishing initiative and ministerial meeting information, news articles, blog posts, & a comprehensive library of CEM tools & resources on the CEM website. Twitter, Facebook, and YouTube are our social media platforms, while the e-newsletter and website are additional digital media platforms. Target audiences for stakeholder outreach: CEM participating governments, policy makers in CEM countries NGOs (working in clean energy, energy efficiency, energy access) Climate change constituencies The energy-interested public Private-sector and industry representatives The targeted outcomes of this outreach include: Increased awareness of the CEM & its work Increased use of CEM information & tools Year-round discussion about CEM and its work Extended reach for CEM communications – secondary exposure gained by other organizations’ & individuals’ reuse/sharing of our content
- Exposure is about who sees your content, how many new or secondary audiences are exposed to your content, and whether your content is reaching your target audiences. Awareness: Users that take action with your content – giving it the thumbs up or sharing it with their friends/followers – are demonstrating awareness. They have seen your content and recognized its value, choosing to like it or share it. Discussion is about who is talking about you, and to what extent they are doing so. Use is about getting users to access your content – to read the news article, click to view the PDF, watch the video, etc.
- Fan growth is a broad gauge of how healthy your community is. A rising number of fans and followers can indicate two key things – growing interest in your page, and/or growing use of a particular platform. Facebook’s rate of growth is slowing, for example, which could in turn reduce the fan base for our Facebook followers. Among the 3 social platforms that allow users to like or follow us, twitter has shown the most explosive growth – lifted by our Jan. 2014 decision to repeat tweets in the early-morning hours (to reach audiences in Europe, etc.), as well as growth in overall use of twitter. On May 31, twitter was approaching 1,000 followers; Facebook was approaching 300 fans, and LinkedIn was approaching 200 members. We often notice a rise in new followers after a large organization (WRI, Power Over Energy, UNFCCC) shares or comments on our content. The rate of growth will slow in the summer. Social media/website use tends to decline in the summer overall, and all of our platforms will lose a little bit of steam, now that the spike of interest/attention around CEM5 has passed.
- Impressions is a measure of how many followers could have seen your content, but in reality, only a small portion of that potential audience will actually see your content. For this reason, it’s more important to pay attention to how your impressions are trending (i.e., rising or falling) than the actual number of impressions. We’re doing well. Impressions include your fan base + the fan bases of other twitter accounts that share or comment on your content. We doubled our number of tweets per day beginning in January 2014 (repeating tweets in early morning hours to appeal to our audiences in Europe), which doubled our baseline number of impressions (8 tweets per day X 900 fans = 7200 impressions, vs. 4 tweets per day X 900 fans = 3600 impressions). Even with this increase, impressions have accelerated in the first half of 2014, boosted by a growing number of retweets overall & a few retweets by groups with particularly large fan bases (such as WRI, UNFCCC).
- Much of the value in social media comes from the community –who are you connecting with. Our active community on twitter – those retweeting us and mentioning us – includes a mix of individuals and organizations. Looking at the organizations, those retweeting and mentioning us span all of CEM’s target audiences and include major influencers like the IEA, IRENA, UNFCCC, etc. This is a partial list of accounts that have retweeted our mentioned us/our content between Feb. 2013 and May 2014.
- Twitter generates more shares per post than Facebook (or any of our other digital media platforms). On twitter, a “favorite” is the equivalent of a “like” on Facebook. On twitter, a “retweet” is the equivalent of a “share” on Facebook.
- Our twitter community is talking about us and chatting with us in a variety of ways. Discussion (both positive and skeptical) is growing. Twitter is our top social/digital platform for discussion. Comment on/repackage our tweets
- On Facebook, we have had approximately 100 organizations or individuals like or share our content. About 20% of the accounts liking and sharing our content are organizations, with about half of that being from target audiences such as energy NGOs, industry groups, and climate constituencies. The other half includes embassies, causes, consumer outreach campaigns, and green/environmental campaigns. The Clean Energy Solutions Center is one of the leading sources of likes and shares for our page. About 80% of the accounts liking and sharing our content are individuals – members of the energy-interested public. This is a partial list of accounts that have liked or shared our content between Feb. 2013 and May 2014.
- The goal of connecting with a community is to then have them interact with your content – like it, share it, etc. This is key to your mission (raising awareness), but also drives greater exposure for your content, introducing it to new (and potentially large) new audiences. On Facebook, Vickie Healey & the Clean Energy Solutions Center are by far the biggest source of interaction – regularly liking & sharing our content. If that were to stop, our Facebook numbers would drop off steeply. Facebook has the highest likes per post.
- The most liked on our own page is the Model CEM post from May 2014. The UAE Sustainability week post (right) had the highest number of secondary (viral) likes, comments, and shares. The post was shared by Power Over Energy, a large consumer-facing energy literacy campaign. With 100,000+ followers, their share gave this post great visibility.
- Strengths Provides a home for our videos Enables us (and others) to easily share them via social media
- 28% of members identify themselves as members of the renewables & energy sector.
- The newsletter is a solid source of clicks – averaging 300 clicks or more per issue. The newsletter links users to CEM website content almost exclusively, while social media refers users to both CEM and non-CEM content.
- See longer presentation (which accompanied this Highlights presentation) for more information about page views.
- Period shown: Feb. 2013 through May 2014. PDF clicks: 2013: 972 per month Jan - Apr 2014: 1163 per month May-14: 1603 per month Link Clicks 2013: 718 per month Jan - Apr 2014: 814 per month May-14:1028 per month
- Twitter: It’s good twitter etiquette to reply/respond when audiences interact with us on twitter (via comments, replies, etc.) Our latest analysis shows top Facebook days are Tuesday, Thursday, and Friday, which is a change from a prior analysis that showed weekends as the top day. We will continue to evaluate this over time and make adjustments to the content schedule as needed.
- Website objectives could include increasing traffic to entire site, increasing traffic to particular pages, etc. Each possible objective requires a different marketing strategy, so it’s important to determine our top priority and then tailor a plan to address it.


