Centazzo Media, Advertising And Consumer Trends 2011
- 1. Media and Advertising Snapshot Consumer Behavior and Trends 2011 Troy K. Centazzo
- 2. The Ad Universe (Pre-Internet) Print Advertisements in Newspapers and Magazines; Short and Long-Form Commercials and Sponsorships on Radio and Television; Billboards and Signs; Public Relations; Direct Mail and Catalogs; Tiny Classified Ads; Network Marketing; Trade Shows and Conferences
- 3. The Digital Ad / Marketing Universe (circa January 2011) Enormous innovation: companies now have thousands of new tools to communicate Emerging Advertising / Marketing Business Models Data, Analytics, Optimization Ad Networks (Currently Hundreds Exist) Ad Exchanges Ad Serving / Rich Media Performance Advertising Data Sources, Aggregators Demand Side Platforms Publisher Side Platforms Mobile / Video Ads Verification / Attribution A result of robust, early stage sector investment Media Buying Platforms and capital efficient business models
- 4. Consumers and “Traditional” Media – Drifting Apart? Change in Average Time Spent Per Day with Media Types by US Adults 2009: -13.2% Includes Video 2010: -9.1% 2009: -3.9% 2009: +5.1% 2009: -12.0% 2010: -2.0% 2010: -1.1% Flat Over Last 5 Years 2010: -9.1% Source: eMarketer, Dec. 2010.
- 5. So What Are Those Consumers Spending Their Time Doing? The Rapid Rise of Cell Phones (and now Tablets) in the US and Around the World US Smartphone Penetration 60% Mobile Subscriptions per 100 Inhabitants (2000-10) 50% 40% 30% US = ͠100% 20% 10% 0% Q4, 2008 Q4, 2009 Q4, 2010 Q4, 2011 US = ͠45% (E) Projected Growth of Tablet Sales, US Adults Sources: ITU World Telecommunications; Forrester Research, Inc.; Nielson; Forrester Research, Inc.
- 6. So What Are Consumers Spending Their Time Doing? For the first time, Americans now spend as much time on the Internet as they do watching TV (13 hours per week)* 45% Have a DVR Up 121% Over Last 5 Years Share of Time Spent on Internet (2010) (on PCs and Laptops) Social Networks / Blogs: Games: Email: 22.7%, up 43% from 2009 10.2%, up 10% 8.3%, down from 2009 28% from 2009 * Note: A recent meta-study by eMarketer concluded that US adults spent 40% of their time with media watching TV and 24% on the Internet. Sources: The Nielson Company; eMarketer (2010).
- 7. So What Are Those Consumers Spending Their Time Doing? Time spent on mobile devices – increasingly smartphones and tablets – is rising the fastest compared to other media Change in Time Spent Using Mobile Devices Over Prior Year Share of Time Spent on Smartphones (US & UK) 40.0% 21.9% 28.2% Research Has Shown Much Diversity: 2009 2010 2011 (E) • 50% of time spent keeping in touch with others (email, text, phone calls) • 20% - media (music, videos, pictures) and games) • 12% browsing the internet • 2% on “productive” activities Sources: eMarketer (2010); Falaki, Hossein et al. 2010. Diversity in Smartphone Usage. MobiSys’10
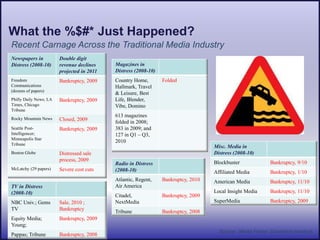
- 8. What the %$#* Just Happened? Recent Carnage Across the Traditional Media Industry Newspapers in Double digit Distress (2008-10) revenue declines Magazines in projected in 2011 Distress (2008-10) Freedom Bankruptcy, 2009 Country Home, Folded Communications Hallmark, Travel (dozens of papers) & Leisure, Best Philly Daily News; LA Bankruptcy, 2009 Life, Blender, Times, Chicago Vibe, Domino Tribune 613 magazines Rocky Mountain News Closed, 2009 folded in 2008; Seattle Post- Bankruptcy, 2009 383 in 2009; and Intelligencer; 127 in Q1 – Q3, Minneapolis Star 2010 Tribune Misc. Media in Boston Globe Distressed sale Distress (2008-10) process, 2009 Radio in Distress Blockbuster Bankruptcy, 9/10 McLatchy (29 papers) Severe cost cuts (2008-10) Affiliated Media Bankruptcy, 1/10 Atlantic, Regent, Bankruptcy, 2010 American Media Bankruptcy, 11/10 TV in Distress Air America (2008-10) Local Insight Media Bankruptcy, 11/10 Citadel, Bankruptcy, 2009 NBC Univ.; Gems Sale, 2010 ; NextMedia SuperMedia Bankruptcy, 2009 TV Bankruptcy Tribune Bankruptcy, 2008 Equity Media; Bankruptcy, 2009 Young; Source: Media Finder, Growthink research. Pappas; Tribune Bankruptcy, 2008
- 9. Advertisers Have (Partially) Responded to These Rapid Changes • 2010 brought a recovery to the advertising and public relations sectors, which is expected to continue through 2011 • $300 billion in US and $500 billion worldwide (5% growth in 2011) • 2/3 of PR agencies reported double digit growth in 2010 • Online increased to $25.8B, equaling spend on print for the first time • Facebook ad spend equaled $1.86B ($1.2B in US and $.65 outside US) US Ad Spend (2010) 1% 23% Television 52% Online 24% Newpaper Print Sources: eMarketer (Dec, 2010);
- 10. About the Author Troy is an Engagement Partner at GT Securities/Growthink, where he leads investment banking and consulting engagements for the firm’s clients. He focuses on convergence media. Troy brings to GT more than 20 years of experience advising corporations at all stages of development, from start-up firms to Fortune 500 companies. Troy joins Growthink’s Los Angeles office after serving as the founding Principal of MBL, an advisory and investment firm that assisted clients in all areas of business, including developing their strategies and raising Troy Centazzo capital. Also a seasoned entrepreneur, he helped found, manage and Engagement Partner invest in several start-up companies, primarily in the consumer products, technology and New Media sectors while at and before MBL. Digital Media Expert Troy additionally worked as an Associate in the Investment Banking and Merchant Banking Divisions at Donaldson, Lufkin & Jenrette (DLJ, now Contact: CS First Boston). His first job after college was serving as the founding Director of the RI Enterprise Zone Program. Cell: (202) 369-2188 Education Email • JD, Law School; MBA, Darden School, University of Virginia (Winner, The Faculty Award; Raven Society) LinkedIn • BA, Brown University (Honors; Class Co-President) Twitter


