


Chapter 12.Risk and Return
- 2. Defining Return Income receivedIncome received on an investment plus any change in market pricechange in market price, usually expressed as a percent of the beginning market pricebeginning market price of the investment. DDtt + (PPtt - P- Pt-1t-1 ) PPt-1t-1 R = 2
- 3. Return Example The stock price for Stock A was $10$10 per share 1 year ago. The stock is currently trading at $9.50$9.50 per share and shareholders just received a $1 dividend$1 dividend. What return was earned over the past year? 3
- 4. Return Example The stock price for Stock A was $10$10 per share 1 year ago. The stock is currently trading at $9.50$9.50 per share and shareholders just received a $1 dividend$1 dividend. What return was earned over the past year? $1.00$1.00 + ($9.50$9.50 - $10.00$10.00 ) $10.00$10.00RR = = 5%5% 4
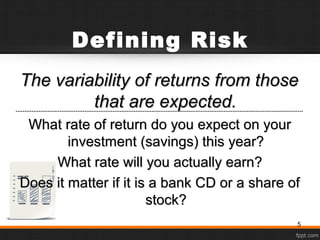
- 5. Defining Risk What rate of return do you expect on yourWhat rate of return do you expect on your investment (savings) this year?investment (savings) this year? What rate will you actually earn?What rate will you actually earn? Does it matter if it is a bank CD or a share ofDoes it matter if it is a bank CD or a share of stock?stock? The variability of returns from thoseThe variability of returns from those that are expected.that are expected. 5
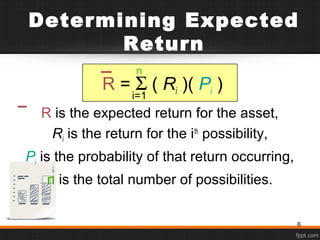
- 6. Determining Expected Return R = Σ ( Ri )( Pi ) R is the expected return for the asset, Ri is the return for the ith possibility, Pi is the probability of that return occurring, n is the total number of possibilities. n i=1 6
- 7. How to Determine the Expected Return and Standard Deviation Stock BW Ri Pi (Ri)(Pi) -.15 .10 -.015 -.03 .20 -.006 .09 .40 .036 .21 .20 .042 .33 .10 .033 Sum 1.00 .090.090 The expected return, R, for Stock BW is .09 or 9% 7
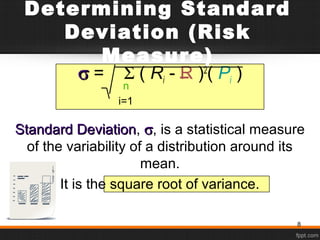
- 8. Determining Standard Deviation (Risk Measure) σσ = Σ ( Ri - R )2 ( Pi ) Standard DeviationStandard Deviation, σσ, is a statistical measure of the variability of a distribution around its mean. It is the square root of variance. n i=1 8
- 9. How to Determine the Expected Return and Standard Deviation Stock BW Ri Pi (Ri)(Pi) (Ri - R )2 (Pi) -.15 .10 -.015 .00576 -.03 .20 -.006 .00288 .09 .40 .036 .00000 .21 .20 .042 .00288 .33 .10 .033 .00576 Sum 1.00 .090.090 .01728.01728 9
- 10. Determining Standard Deviation (Risk Measure) σσ = Σ ( Ri - R )2 ( Pi ) σσ = .01728 σσ = .1315.1315 or 13.15%13.15% n i=1 10
- 11. Coefficient of Variation The ratio of the standard deviationstandard deviation of a distribution to the meanmean of that distribution. It is a measure of RELATIVERELATIVE risk. CV = σσ / RR CV of BW = .1315.1315 / .09.09 = 1.46 11
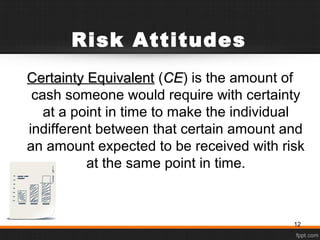
- 12. Certainty EquivalentCertainty Equivalent (CECE) is the amount of cash someone would require with certainty at a point in time to make the individual indifferent between that certain amount and an amount expected to be received with risk at the same point in time. Risk Attitudes 12
- 13. Certainty equivalent > Expected value Risk PreferenceRisk Preference Certainty equivalent = Expected value Risk IndifferenceRisk Indifference Certainty equivalent < Expected value Risk AversionRisk Aversion Most individuals are Risk AverseRisk Averse. Risk Attitudes 13
- 14. Risk Attitude Example You have the choice between (1) a guaranteed dollar reward or (2) a coin-flip gamble of $100,000 (50% chance) or $0 (50% chance). The expected value of the gamble is $50,000. – Mary requires a guaranteed $25,000, or more, to call off the gamble. – Raleigh is just as happy to take $50,000 or take the risky gamble. – Shannon requires at least $52,000 to call off the gamble. 14
- 15. What are the Risk Attitude tendencies of each?What are the Risk Attitude tendencies of each? Risk Attitude Example Mary shows “risk aversion”“risk aversion” because her “certainty equivalent” < the expected value of the gamble.. Raleigh exhibits “risk indifference”“risk indifference” because her “certainty equivalent” equals the expected value of the gamble.. Shannon reveals a “risk preference”“risk preference” because her “certainty equivalent” > the expected value of the gamble.. 15
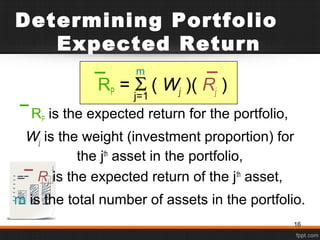
- 16. RP = Σ ( Wj )( Rj ) RP is the expected return for the portfolio, Wj is the weight (investment proportion) for the jth asset in the portfolio, Rj is the expected return of the jth asset, m is the total number of assets in the portfolio. Determining Portfolio Expected Return m j=1 16
- 17. Determining Portfolio Standard Deviation m j=1 m k=1 σσPP = Σ Σ Wj Wk σjk Wj is the weight (investment proportion) for the jth asset in the portfolio, Wk is the weight (investment proportion) for the kth asset in the portfolio, σjk is the covariance between returns for the jth and kth assets in the portfolio. 17
- 18. Standard Deviation of Two Asset Portfolio The before mentioned formula can be expressed as following for two asset portfolio; σσPP==√W√Wjj 22 σσjj 22 ++WWkk 22 σσkk 22 +2W+2WjjWWkkσσjkjk wherewhere σσjk isjk is covariancecovariance or,or, σσPP==√W√Wjj 22 σσjj 22 ++WWkk 22 σσkk 22 +2W+2WjjWWkkrrjkjkσσjjσσkk wherewhererrjkjk is correlation coefficientis correlation coefficient 18
- 19. What is Covariance? σσ jk = σ j σ k rr jk σj is the standard deviation of the jth asset in the portfolio, σkis the standard deviation of the kth asset in the portfolio, rjk is the correlation coefficient between the jth and kth assets in the portfolio. 19
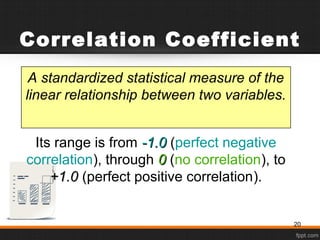
- 20. Correlation Coefficient A standardized statistical measure of the linear relationship between two variables. Its range is from -1.0-1.0 (perfect negative correlation), through 00 (no correlation), to +1.0+1.0 (perfect positive correlation). 20
- 21. You are creating a portfolio of Stock DStock D and Stock BWStock BW (from earlier). You are investing $2,000$2,000 in Stock BWStock BW and $3,000$3,000 in Stock DStock D. Remember that the expected return and standard deviation of Stock BWStock BW is 9%9% and 13.15%13.15% respectively. The expected return and standard deviation of Stock DStock D is 8%8% and 10.65%10.65% respectively. The correlation coefficientcorrelation coefficient between BW and D is 0.750.75. What is the expected return and standardWhat is the expected return and standard deviation of the portfolio?deviation of the portfolio? Portfolio Risk and Expected Return Example 21
- 22. Determining Portfolio Expected Return WBW = $2,000 / $5,000 = .4 WWDD = $3,000 / $5,000 = .6.6 RP = (WBW)(RBW) + (WWDD)(RRDD) RP = (.4)(9%) + (.6.6)(8%8%) RP = (3.6%) + (4.8%4.8%) = 8.4%8.4% 22
- 23. Determining Portfolio Standard Deviation σP = .0028 + (2)(.0025) + .0041 σP = SQRT(.0119) σP = .1091 or 10.91% A weighted average of the individual standard deviations is INCORRECT. 23
- 24. Determining Portfolio Standard Deviation The WRONG way to calculate is a weighted average like: σP = .4 (13.15%) + .6(10.65%) σP = 5.26 + 6.39 = 11.65% 10.91% = 11.65% This is INCORRECT. 24
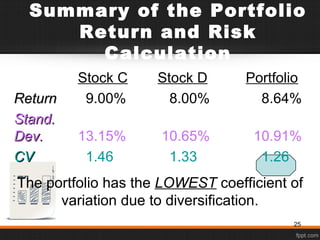
- 25. Stock C Stock D Portfolio ReturnReturn 9.00% 8.00% 8.64% Stand.Stand. Dev.Dev. 13.15% 10.65% 10.91% CVCV 1.46 1.33 1.26 The portfolio has the LOWEST coefficient of variation due to diversification. Summary of the Portfolio Return and Risk Calculation 25
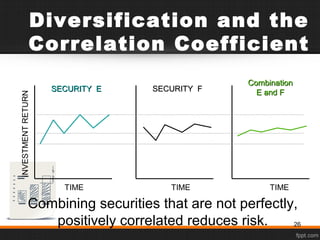
- 26. Combining securities that are not perfectly, positively correlated reduces risk. Diversification and the Correlation Coefficient INVESTMENTRETURN TIME TIMETIME SECURITY ESECURITY E SECURITY FSECURITY F CombinationCombination E and FE and F 26
- 27. Systematic RiskSystematic Risk is the variability of return on stocks or portfolios associated with changes in return on the market as a whole. Unsystematic RiskUnsystematic Risk is the variability of return on stocks or portfolios not explained by general market movements. It is avoidable through diversification. Total Risk = Systematic Risk + Unsystematic Risk Total RiskTotal Risk = SystematicSystematic RiskRisk + UnsystematicUnsystematic RiskRisk 27
- 28. Total Risk = Systematic Risk + Unsystematic Risk TotalTotal RiskRisk Unsystematic riskUnsystematic risk Systematic riskSystematic risk STDDEVOFPORTFOLIORETURN NUMBER OF SECURITIES IN THE PORTFOLIO Factors such as changes in nation’s economy, tax reform by the Congress, or a change in the world situation. 28
- 29. Total Risk = Systematic Risk + Unsystematic Risk TotalTotal RiskRisk Unsystematic riskUnsystematic risk Systematic riskSystematic risk STDDEVOFPORTFOLIORETURN NUMBER OF SECURITIES IN THE PORTFOLIO Factors unique to a particular company or industry. For example, the death of a key executive or loss of a governmental defense contract. 29
- 30. CAPM is a model that describes the relationship between risk and expected (required) return; in this model, a security’s expected (required) return is the risk-free raterisk-free rate plus a premiuma premium based on the systematic risksystematic risk of the security. Capital Asset Pricing Model (CAPM) 30
- 31. 1. Capital markets are efficient. 2. Homogeneous investor expectations over a given period. 3. Risk-freeRisk-free asset return is certain (use short- to intermediate-term Treasuries as a proxy). 4. Market portfolio contains only systematic risksystematic risk (use S&P 500 Index or similar as a proxy). CAPM Assumptions 31
- 32. An index of systematic risksystematic risk. It measures the sensitivity of a stock’s returns to changes in returns on the market portfolio. The betabeta for a portfolio is simply a weighted average of the individual stock betas in the portfolio. What is Beta? 32
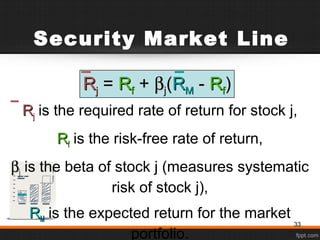
- 33. RRjj is the required rate of return for stock j, RRff is the risk-free rate of return, ββjj is the beta of stock j (measures systematic risk of stock j), RRMM is the expected return for the market portfolio. Security Market Line RRjj = RRff + ββj(RRMM - RRff) 33
- 34. Security Market Line RRjj = RRff + ββj(RRMM - RRff) ββMM = 1.01.0 Systematic Risk (Beta) RRff RRMM RequiredReturnRequiredReturn RiskRisk PremiumPremium Risk-freeRisk-free ReturnReturn 34
- 35. Lisa Miller at Basket Wonders is attempting to determine the rate of return required by their stock investors. Lisa is using a 6% R6% Rff and a long-term market expected rate of returnmarket expected rate of return of 10%10%. A stock analyst following the firm has calculated that the firm betabeta is 1.21.2. What is the required rate of returnrequired rate of return on the stock of Basket Wonders? Determination of the Required Rate of Return 35
- 36. RRBWBW = RRff + ββj(RRMM - RRff) RRBWBW = 6%6% + 1.21.2(10%10% - 6%6%) RRBWBW = 10.8%10.8% The required rate of return exceeds the market rate of return as BW’s beta exceeds the market beta (1.0). BWs Required Rate of Return 36
- 37. Lisa Miller at BW is also attempting to determine the intrinsic valueintrinsic value of the stock. She is using the constant growth model. Lisa estimates that the dividend next perioddividend next period will be $0.50$0.50 and that BW will growgrow at a constant rate of 5.8%5.8%. The stock is currently selling for $15. What is the intrinsic valueintrinsic value of the stock? Is the stock overover or underpricedunderpriced? Determination of the Intrinsic Value of BW 37
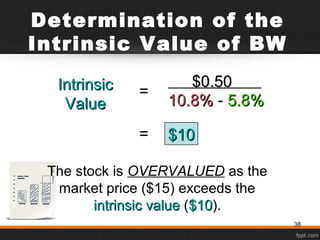
- 38. The stock is OVERVALUED as the market price ($15) exceeds the intrinsic valueintrinsic value ($10$10). Determination of the Intrinsic Value of BW $0.50$0.50 10.8%10.8% - 5.8%5.8% IntrinsicIntrinsic ValueValue = = $10$10 38
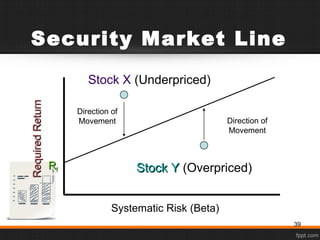
- 39. Security Market Line Systematic Risk (Beta) RRff RequiredReturnRequiredReturn Direction of Movement Direction of Movement Stock YStock Y (Overpriced) Stock X (Underpriced) 39
- 40. Thank You