Community liason-group-presentation-10-02-2015
•
1 like•37,397 views

The document discusses integrated transport solutions for Auckland, New Zealand to address increasing congestion challenges from population and employment growth. It finds that the City Rail Link (CRL) alone will not meet future transit demand and that light rail is needed to optimize the road network and transport access within the city center. Light rail could move more people with less road space than buses and help shape development. The summary concludes that both CRL construction and further evaluation of light rail solutions are needed with regular updates to council.
Report
Share


Community liason-group-presentation-10-02-2015
- 1. 1 Integrated transport - investing in Auckland’s Future Briefing to Auckland Council February 2015
- 2. 2 Overview • Strategic Context • City Rail Link • Light Rail • Summary
- 4. 4
- 5. 5 City Access • The number of people entering the city centre is increasing • Since 2001, more people take PT to the city centre during the morning peak and fewer take cars
- 8. 8 Frequent Transit Network (FTN)
- 9. 9 Rapid Transit Network (RTN)
- 10. 10 • CRL does not address access from the north, the central and southern isthmus or university and Wynyard Quarter • Buses from non rail areas will create significant congestion and affect economic growth • Bus terminal capacity is at a premium and will become challenging and costly • More of the same means bumper to bumper cars will be replaced by wall to wall buses Light Rail
- 11. 11 CCFAS Findings Albert Street Fanshawe Street Now 2021 2041 Network at capacity, especially on critical corridors Bus volumes on key routes will need to double Virtually all key road corridors at capacity Vehicle speeds 16kph Vehicle speeds more than halve to 7kph Vehicle speeds down to walking speed- 5kph Rail approaching capacity No additional rail services can be provided Rail over capacity but additional services can’t be provided Access to city centre becoming constrained Access to city becoming restricted Demand for travel to city centre cannot be met • Access crisis into the city centre by 2021 with medium population growth and despite completion of all (pre-CRL) planned transport improvements. • Auckland’s growth will outstrip its road capacity and maximising rail is an essential part of an integrated access solution • Bus-only investment will meet demand for only a few years and require significant land take for priority lanes and depots
- 12. 12 CCFAS2 Objectives • Significantly contribute to lifting and shaping Auckland's economic growth • Improve the efficiency and resilience of the transport network of inner Auckland and the city centre • Improve transport access into and around the city centre to address current problems and for a rapidly growing Auckland • Provide a sustainable transport solution that minimises environmental impacts • Contribute positively to a liveable, vibrant and safe city • Optimise the potential to implement a feasible solution
- 13. 13 Corridors: Comprehensive review of urban arterials and city centre corridors Focus on those with significant PT patronage and/or connections to significant land use Modes: Multi modal combinations considered including a mix of public transport options: • Bus, high capacity bus (double decker/bendy), bus rapid transit • Commuter rail • Light rail Network: Multi modal networks were developed that targeted forecast demands Different combinations of corridors and modes were developed All network options included CRL and surface bus improvements New bus network CCFAS2 scope
- 14. 14 Modal Characteristics Bus shared path Bus lane separate Busway priority Light rail shared path Light rail priority Commuter rail Maximum capacity (people/hr) 2,500 4,000 6,000 12,000 18,000 20/25,000 Average speed (km/h) 10-14 14-18 15-22 15-22 18-40 18-40 Cost (est) $m/km n/a <1 35 20-40 50-100 > Typical mode capacity
- 15. 15 Commuter and light rail Commuter rail – CRL – links what exists • A regional solution to optimise rail for an efficient transport network Light rail- a new solution • Optimises road within the transport network
- 17. 17 City Rail Link CRL • CCFAS identified CRL with surface bus improvements as the only option to meet predicted transport demand • Auckland’s number one transport priority • Provides for growth • Catalyst for economic development • Integrated land use • Supports special housing areas • Environmental imperatives
- 18. 18 CRL Travel Times CRL
- 19. 19 “Auckland’s central business district needs 18 more PWC Towers, 18 Metropolis buildings and 18 shopping centres by 2031” – Alan McMahon national director of research and consulting at Colliers International CRL - Driving Auckland Development “The CRL is the foremost transformational project in the next decade. It creates the most significant place shaping opportunity” – Auckland Plan Development opportunities CRL
- 20. 20 • CRL notified Jan 2013 • Designation confirmed April 2014 • Six appeals now in mediation • About 70 properties being purchased- nearly 50 to date • About 30,000sq m of property under active management • November 2014 – Council resolved to fund early construction • Subterranean purchase to start this year CRL progress CRL
- 22. 22 • 100 strong integrated design team in co-located project office • Expertise drawn from New Zealand, Europe, Asia, America and Australia • Benchmarking best practice from new underground railways around the world • Significant design work with Manawhenua to combine cultural and technical excellence to create a unique experience Design Progress CRL
- 23. 23 Britomart CRL
- 24. 24 Aotea CRL
- 25. 25 K Road- Mercury Lane Entrance CRL
- 26. 26 Mt Eden Station Redevelopment CRL
- 28. 28 Construction Works Packages CRL Contract 1 – Britomart to Downtown Shopping Centre (DSC) • Temporary accommodation at Britomart behind the glass box • Temporary bridging and decking for pedestrians and cyclists on lower Queen St • Removing the subway between the CPO building and DSC Downtown Shopping Centre (DSC) • Precinct to develop a 40 level tower on DSC site, and constructing CRL tunnels below
- 29. 29 Construction Works Packages CRL Contract 2 – Albert St from Downtown Shopping Centre to Wyndham St • Running tunnels up Albert St to the southern side of the Wyndham St intersection • A laydown area in lower Albert St and keeping Customs St active • Stormwater relocation from Wellesley to Swanson Streets
- 30. 30 Early 2015 • Resource consents notified • DSC agreement • Early works design contract awarded • Community Liaison Group (CLG) set up • Main works reference design Mid – late 2015 • Early works detailed design complete • Negotiation process for early works construction • Work starts at Britomart to Wyndham Street 2016+ • Works progress in the city centre and become more evident • CLG continues • Ongoing communication with affected parties Enabling Works Construction Timeline CRL
- 31. 31 Light Rail
- 32. 32 • Horse drawn trams start 1884 • Electric trams start 1902 • Last tram 1956 – covered 72kms • Trolley buses roll out 1949-56 • Trolley buses end 1980 History LRT Overview More recently • 1990 NZ Rail proposed light rail to ARC and ACC • ARC proposed light rail on western line and city centre • ACC future proofs Britomart for light rail • Central Transit corridor design in early 2000s • 2012 CCMP includes light rail potential • Waterfront Plan considers trams
- 33. 33 Past Tram Network LRT Overview
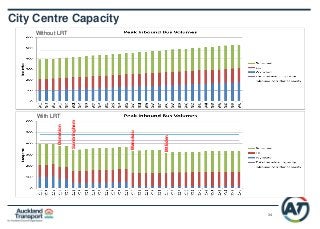
- 34. 34 City Centre Capacity Without LRT Dominion Sandringham Manukau MtEden With LRT
- 35. 35 Future city centre transport network LRT Overview
- 36. 36 Queen St past and future LRT Overview
- 37. 37 Britomart past and Fanshawe Street future LRT Overview
- 38. 38 • Greater capacity (300 people) • Uses less road space • More doors to keep the dwell times below 30 seconds at peak • Faster • Level boarding across a narrow gap • Improved way finding • Space efficient- no need for terminus or turn around • Quiet • More likely to get people out of their cars • Permanent infrastructure encouraging development Key Features/benefits LRT Overview
- 39. 39 International Experience LRT Overview Gold Coast - ahead of expectations - 238k passenger trips in the first 14 days
- 40. 40 Heritage/Civic Spaces LRT Overview
- 41. 41 Summary
- 42. 42 • CRL starts construction later this year • No solution to city centre road congestion identified that doesn’t involve light rail • Regular report back to council on these initiatives Summary
- 43. 43 Transport - Conclusions • There is an established way of approach transport appraisal based on straight line growth forecasts and values of time with fixed population and employment patterns, but it is not clear that it reflects what actually happens • In reality transport drives land use patterns just as much as land use drives transport demand