constellation energy Q3 2006 Earnings Presentation
- 1. Constellation Energy Q3 2006 Earnings October 27, 2006
- 2. Forward-looking Statements Disclaimer Certain statements made in this presentation are forward-looking statements and may contain words such as “believes,” “anticipates,” “expects,” “intends,” “plans,” and other similar words. We also disclose non-historical information that represents management’s expectations, which are based on numerous assumptions. These statements are not guarantees of future performance and are subject to risks and uncertainties that could cause actual results to be materially different from projected results. These risks include, but are not limited to: the timing and extent of changes in commodity prices for energy including coal, natural gas, oil, electricity, nuclear fuel, and emissions allowances; the timing and extent of deregulation of, and competition in, the energy markets, and the rules and regulations adopted on a transitional basis in those markets; the conditions of the capital markets, interest rates, availability of credit, liquidity and general economic conditions, as well as Constellation Energy’s and BGE’s ability to maintain their current credit ratings; the ability to attract and retain customers in our competitive supply activities and to adequately forecast their energy usage; the effectiveness of Constellation Energy’s and BGE’s risk management policies and procedures and the ability and willingness of our counterparties to satisfy their financial and other commitments; the liquidity and competitiveness of wholesale markets for energy commodities; uncertainties associated with estimating natural gas reserves, developing properties and extracting gas; operational factors affecting the operations of our generating facilities (including nuclear facilities) and BGE’s transmission and distribution facilities, including catastrophic weather-related damages, unscheduled outages or repairs, unanticipated changes in fuel costs or availability, unavailability of coal or gas transportation or electric transmission services, workforce issues, terrorism, liabilities associated with catastrophic events, and other events beyond our control; the inability of BGE to recover all its costs associated with providing electric residential customers service; the effect of weather and general economic and business conditions on energy supply, demand, and prices; regulatory or legislative developments that affect deregulation, transmission or distribution rates, demand for energy, or that would increase costs, including costs related to nuclear power plants, safety, or environmental compliance; the actual outcome of uncertainties associated with assumptions and estimates using judgment when applying critical accounting policies and preparing financial statements, including factors that are estimated in applying mark-to-market accounting, such as the ability to obtain market prices and in the absence of verifiable market prices, the appropriateness of models and model impacts (including, but not limited to, extreme contractual load obligations, unit availability, forward commodity prices, interest rates, correlation and volatility factors); changes in accounting principles or practices; losses on the sale or write-down of assets due to impairment events or changes in management intent with regard to either holding or selling certain assets; our ability to successfully identify and complete acquisitions and sales of businesses and assets; cost and other effects of legal and administrative proceedings that may not be covered by insurance, including environmental liabilities; Given these uncertainties, you should not place undue reliance on these forward-looking statements. Please see our periodic reports filed with the SEC for more information on these factors. These forward-looking statements represent estimates and assumptions only as of the date of this presentation, and no duty is undertaken to update them to reflect new information, events or circumstances. 2
- 3. Use of Non-GAAP Financial Measures Constellation Energy presents adjusted earnings per share (adjusted EPS) in addition to its reported earnings per share in accordance with generally accepted accounting principles (reported GAAP EPS). Adjusted EPS is a non-GAAP financial measure that differs from reported GAAP EPS because it excludes the cumulative effects of changes in accounting principles, discontinued operations, special items (which we define as significant items that are not related to our ongoing, underlying business or which distort comparability of results) included in operations, the impact of certain economic, non-qualifying hedges, and synfuel earnings. The mark-to-market impact of these hedges is significant to reported results, but economically neutral to the company in that offsetting gains or losses on underlying accrual positions will be recognized in the future. We present adjusted EPS because we believe that it is appropriate for investors to consider results excluding these items in addition to our results in accordance with GAAP. We believe such measures provide a picture of our results that is comparable among periods since it excludes the impact of items such as workforce reduction costs or gains and losses on the sale of assets, which may recur occasionally, but tend to be irregular as to timing, thereby distorting comparisons between periods. However, investors should note that these non-GAAP measures involve judgments by management (in particular, judgments as to what is classified as a special item or an economic, non-qualifying hedge to be excluded from adjusted earnings). These non-GAAP measures are also used to evaluate management's performance and for compensation purposes. Constellation Energy also provides its earnings guidance in terms of adjusted EPS. Constellation Energy is unable to reconcile its guidance to GAAP earnings per share because we do not predict the future impact of special items, economic, non-qualifying hedges or synfuel earnings due to the difficulty of doing so. The impact of special items, economic, non-qualifying hedges, or synfuel earnings could be material to our operating results computed in accordance with GAAP. We note that such information is not in accordance with GAAP and should not be viewed as an alternative to GAAP information. A reconciliation of pro-forma information to GAAP information is included either on the slide where the information appears or on one of the slides in the Non-GAAP Measures section provided at the end of the presentation. Please see the Summary of Non-GAAP Measures included to find the appropriate GAAP reconciliation and its related slide(s). These slides are only intended to be reviewed in conjunction with the oral presentation to which they relate. 3
- 4. Merger Termination • Reached joint and amicable agreement with FPL Group to terminate merger – Termination request initiated by Constellation – Tremendous respect for FPL Group • Risks and uncertainties in Maryland too significant to overcome – Created potential for protracted and open-ended merger review process – Company minimized distractions from merger process and focused on delivering results in the interim – Imprudent to expose commercial businesses to indefinite uncertainty • Termination not driven by any single or isolated event – Recognition that no clear path led to merger completion – No events on the horizon would create certainty in the near term • Right decision for shareholders to focus Constellation’s efforts on growth that the company can control • Working constructively to balance needs of Maryland and maintaining a financially healthy utility 4
- 5. Q3 2006 Adjusted EPS Summary Q3 2006 Q3 2005 ($ per share) GAAP Earnings $1.79 $1.03 Special Items 0.08 - (Gain) / Loss on Economic Non-Qualifying Hedges (0.20) 0.13 Synfuel Earnings (0.11) (0.08) Adjusted Earnings $1.56 $1.08 Q3 Earnings Guidance $1.10 - $1.25 A proven business model, crisp execution and rigorous risk management has enabled Constellation to deliver 20 consecutive quarters of meeting or exceeding management guidance 5 See Appendix
- 6. Q3 2006 Operating Highlights • Merchant business delivered exceptional results in all areas – Commodities Delivered strong new business growth via power and portfolio management and trading Sustained pattern of adding to backlog of future earnings – NewEnergy Continued gross margin improvement driven by improved pricing and lower costs to serve load Strong third quarter sales volumes and high retention rates – Generation Improving results driven by roll off of below-market sales from the fleet On target to achieve full-year productivity target for 2006 • BGE performing in line with expectations • S&P upgraded CEG senior unsecured debt rating to BBB+ from BBB 6
- 7. Sale of Gas-fired Merchant Plants • Announced sale of gas-fired generation plants to Tenaska Power Fund L.P. on October 11, 2006, for $1.635 billion in cash – Plants sold on a merchant basis – After-tax proceeds expected to be approximately $1.5 billion – Expect closing by end of 2006 or in early 2007 • Continuation of a consistent pattern to evaluate owned and prospective assets and buy or sell when values are attractive • If proceeds used to repurchase debt and equity proportional to existing capital structure, transaction would be neutral in 2007 and accretive thereafter • Proceeds expected to be applied to debt reduction – Should reach long-term target net debt to total capital ratio of 40% upon completion of divestiture – Balance of proceeds and future free cash flow will be available to invest in growth businesses or to repurchase debt and equity to maintain long-term leverage ratio • Including effect of de-levering, transaction will be modestly dilutive through 2009 and accretive thereafter • Continue to evaluate opportunities to grow our asset base 7
- 8. Strategic Fundamentals • Business built on foundation of low-cost baseload fleet – High quality assets located in high-value markets • Industry-leading intermediation businesses – Significantly leveraging the value of our physical asset base – Provide high-value products and services to customers • Strong cash flow generation and solid balance sheet enables deployment of capital to continue growth – Solid track record of managing capital investment to achieve above-hurdle rate returns throughout the commodity cycle 8
- 9. Long-term Growth Supportive Long-term Commodity Price Outlook Expiration of hedges established in 2004 and early 2005 Roll off of Below-Market Fleet Sales for 2006-2007 imply growing 2008 and 2009 margins Expiration of Nine Mile Point PPA in 2009 and 2011 Fundamental Growth Drivers Wholesale Pattern of building backlog Moderating new business growth Growing Market Share as Retail (commercial & industrial) Commodities Intermediary Realistic switched market growth Modest market share gains Modestly improving margins Specific targets, detailed plans Productivity Pattern of execution Ginna Uprate Generate strong cash flow Invest in above hurdle rate projects Reinvestment of Cash Flow If none identified – return cash to shareholders as possible 9
- 10. Solid Base of Growing Earnings 3.0 2.5 Commodities New Business EBITDA ($ billions) 2.0 Commodities Backlog at 9/30 1.5 Retail Businesses 1.0 Generation Fleet 0.5 BGE 0.0 2004 2005 2006 2007 2008 Utility Generation Retail Businesses Commodities - Backlog at 9/30 Commodities - New Business • Earnings from low-risk sources represent 87% of 2007 EBITDA and 86% of 2008 EBITDA - Base of utility earnings - Highly hedged generation output - Retail businesses (NewEnergy) with high customer retention rates - Strong Commodities backlog of already-originated transactions 10 Note: Includes gas-fired merchant plants, except High Desert
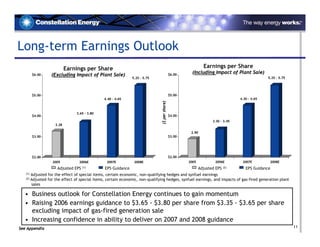
- 11. Long-term Earnings Outlook Earnings per Share Earnings per Share (Including Impact of Plant Sale) (Excluding Impact of Plant Sale) $6.00 $6.00 5.25 - 5.75 5.25 - 5.75 $5.00 $5.00 4.30 - 4.65 4.40 - 4.65 ($ per share) 3.65 - 3.80 $4.00 $4.00 3.30 - 3.45 3.28 2.90 $3.00 $3.00 $2.00 $2.00 2005 2006E 2007E 2008E 2005 2006E 2007E 2008E (1) (2) Adjusted EPS EPS Guidance Adjusted EPS EPS Guidance (1) Adjusted for the effect of special items, certain economic, non-qualifying hedges and synfuel earnings (2) Adjusted for the effect of special items, certain economic, non-qualifying hedges, synfuel earnings, and impacts of gas-fired generation plant sales • Business outlook for Constellation Energy continues to gain momentum • Raising 2006 earnings guidance to $3.65 - $3.80 per share from $3.35 - $3.65 per share excluding impact of gas-fired generation sale • Increasing confidence in ability to deliver on 2007 and 2008 guidance 11 See Appendix
- 12. Financial Overview E. Follin Smith
- 13. Q3 2006 Adjusted EPS Summary Q3 2006 Q3 2005 ($ per share) GAAP Earnings $1.79 $1.03 Special Items 0.08 - Synfuel Earnings (0.11) (0.08) (Gain) / Loss on Economic Non-Qualifying Hedges (0.20) 0.13 Adjusted Earnings $1.56 $1.08 Q3 Guidance $1.10 - $1.25 See Appendix 13
- 14. Q3 2006 Segment Earnings Per Share (1) ($ per share) Change Q3 2006 Q3 2005 EPS % BGE $0.20 $0.24 ($0.04) (17%) Merchant 1.34 0.84 0.50 60% Other Non-regulated 0.02 - 0.02 NM Adjusted Earnings Per Share $1.56 $1.08 $0.48 44% Q3 2006 Earnings Guidance $1.10 - $1.25 (1) Excludes special items, certain economic, non-qualifying hedges and synfuel earnings See Appendix 14
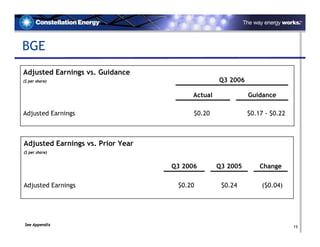
- 15. BGE Adjusted Earnings vs. Guidance Q3 2006 ($ per share) Actual Guidance Adjusted Earnings $0.20 $0.17 - $0.22 Adjusted Earnings vs. Prior Year ($ per share) Q3 2006 Q3 2005 Change Adjusted Earnings $0.20 $0.24 ($0.04) See Appendix 15
- 16. Merchant Adjusted Earnings vs. Guidance Q3 2006 ($ per share) Actual Guidance (1) Adjusted Earnings $1.34 $0.90 - $1.05 Adjusted Earnings vs. Prior Year Q3 2006 Q3 2005 Change ($ per share) Adjusted Earnings (1) $1.34 $0.84 $0.50 Variance Primarily Due to: +34¢ Commodities New Business / Backlog / Lower Cost to Serve Load -18¢ Inflation, Interest, Other +17¢ Mid-Atlantic Price / CTC +14¢ New Energy +3¢ Generation and Headquarters Productivity (1) Excludes special items, certain economic, non-qualifying hedges and synfuel earnings See Appendix 16
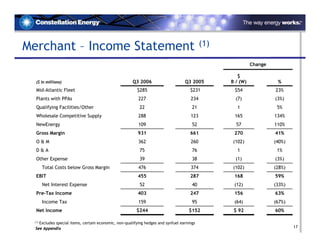
- 17. Merchant – Income Statement (1) Change $ Q3 2006 Q3 2005 B / (W) % ($ in millions) Mid-Atlantic Fleet $285 $231 $54 23% Plants with PPAs 227 234 (7) (3%) Qualifying Facilities/Other 22 21 1 5% Wholesale Competitive Supply 288 123 165 134% NewEnergy 109 52 57 110% Gross Margin 931 661 270 41% O&M 362 260 (102) (40%) D&A 75 76 1 1% Other Expense 39 38 (1) (3%) Total Costs below Gross Margin 476 374 (102) (28%) EBIT 455 287 168 59% Net Interest Expense 52 40 (12) (33%) Pre-Tax Income 403 247 156 63% Income Tax 159 95 (64) (67%) Net Income $244 $152 $ 92 60% (1)Excludes special items, certain economic, non-qualifying hedges and synfuel earnings 17 See Appendix
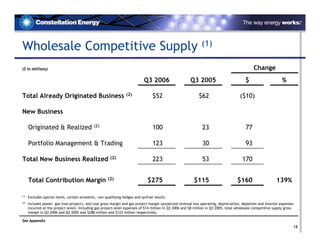
- 18. Wholesale Competitive Supply (1) Change ($ in millions) Q3 2006 Q3 2005 $ % (2) Total Already Originated Business $52 $62 ($10) New Business (2) Originated & Realized 100 23 77 Portfolio Management & Trading 123 30 93 Total New Business Realized (2) 223 53 170 (2) Total Contribution Margin $275 $115 $160 139% (1) Excludes special items, certain economic, non-qualifying hedges and synfuel results (2) Includes power, gas (non-project), and coal gross margin and gas project margin (projected revenue less operating, depreciation, depletion and interest expenses incurred at the project level). Including gas project-level expenses of $14 million in Q3 2006 and $8 million in Q3 2005, total wholesale competitive supply gross margin in Q3 2006 and Q3 2005 was $288 million and $123 million respectively. See Appendix 18
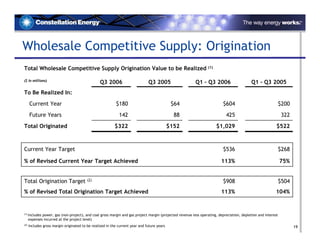
- 19. Wholesale Competitive Supply: Origination Total Wholesale Competitive Supply Origination Value to be Realized (1) ($ in millions) Q3 2006 Q3 2005 Q1 – Q3 2006 Q1 – Q3 2005 To Be Realized In: Current Year $180 $64 $604 $200 Future Years 142 88 425 322 Total Originated $322 $152 $1,029 $522 Current Year Target $536 $268 % of Revised Current Year Target Achieved 113% 75% Total Origination Target $908 $504 (2) % of Revised Total Origination Target Achieved 113% 104% (1) Includes power, gas (non-project), and coal gross margin and gas project margin (projected revenue less operating, depreciation, depletion and interest expenses incurred at the project level) (2) Includes gross margin originated to be realized in the current year and future years 19
- 20. Wholesale Competitive Supply Backlog Backlog (1) $1,000 (as of 9/30/06) New Business Since $750 (2) 12/31/05 (3) Value as of 12/31/05 $ in millions 604 $500 209 $250 98 300 241 194 $0 2006 2007 2008 (1) Includes power, gas (non-project), and coal gross margin and gas project margin (projected revenue less operating, depreciation, depletion and interest expenses incurred at the project level) (2) Includes portfolio value changes for downstream gas and coal 20 (3) Reflects portfolio pricing on 12/15/05
- 21. NewEnergy: Improving Performance Electric Volume Delivered (GWh) Realized Electric Gross Margin (GM / MWh) 75 $5.00 50 $3.00 25 0 $1.00 3rd Quarter YTD 3Q04 1Q05 3Q05 1Q06 3Q06 2005 2006 Retention Rates Market Share (MW) 100% 16,000 12,000 8,000 75% 4,000 0 Q4 2003 Q4 2004 Q4 2005 Q3 2006 50% New Energy Reliant 3Q05 4Q05 1Q06 2Q06 3Q06 TX U Great Plains SUEZ Direc t Energy (US Only) Including Return to Utility Excluding Return to Utility Pepc o Hess Corp. Sempra 21
- 22. NewEnergy: Retail MWh Backlog Contracted Retail MWh (as of 9/30/06) 100 80 MWhs in millions 60 16 40 64 51 20 40 19 0 2005 2006 2007 2008 Delivered Backlog 91% of 2006 plan MWhs delivered or contracted 22
- 23. Limiting Variability – Portfolio Management 2007 2008 2009 Percent Hedged as of 9/30/06 Power 89% 83% 70% Fuel 86% 80% 59% Sensitivity to Price Changes as of 9/30/06 ($ per share) Power down $1/MWh, Fuel unchanged ($0.03) ($0.05) ($0.08) Fuel down $0.10/MMBtu, Power unchanged 0.06 0.04 0.06 Power down $1/MWh, Fuel down $0.10/MMBtu $0.03 ($0.01) ($0.02) • Accrual portfolio managed to reduce exposure of future earnings to changes • MTM portfolio VaR levels remain low at average of $13.9 million in Q3 2006 Note: Percent hedged includes Mid-Atlantic Fleet, Plants with PPA’s, and wholesale and retail competitive supply power businesses. Does not include gas businesses or international coal business. 23
- 24. Productivity Cumulative Productivity 200 150 Pre-tax Earnings ($ millions) 150 89 (1) 100 50 50 0 (50) (40) (100) 2004 2005 2006 2007 Realized Target • Year-to-date, realized $39 million, or 98% of our 2006 productivity target • Since announcing our long-term productivity initiatives, we have added $89 million pre-tax to ongoing annual profits (1) 2006 Productivity target of $40 million; achieved year-to-date productivity of $39 million 24
- 25. Q3 2006 Consolidated Cash Flow Other Merchant Utility Non-Reg Total ($ in millions) Net Income Before Special Items $284 $35 $4 $323 Depreciation & Amortization 79 58 11 148 Capital Expenditures & Investments (147) (78) (10) (235) Net CapEx (68) (20) 1 (87) Working Capital & Other 143 (193) 59 9 (1) Pension Adjustment (pre-tax) 33 Free Cash Flow $359 ($178) $64 $278 Dividends (68) Equity Issuances – Benefit Plans 15 Net Cash Flow before Debt Issuances/(Payments) $225 (1) Includes $176m of deferrals related to the BGE Rate Stabilization Plan 25 See Appendix
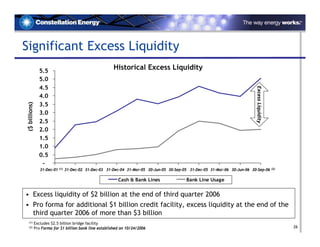
- 26. Significant Excess Liquidity Historical Excess Liquidity 5.5 5.0 4.5 Excess Liquidity 4.0 3.5 ($ billions) 3.0 2.5 2.0 1.5 1.0 0.5 - (1) (2) 31-Dec-01 31-Dec-02 31-Dec-03 31-Dec-04 31-Mar-05 30-Jun-05 30-Sep-05 31-Dec-05 31-Mar-06 30-Jun-06 30-Sep-06 Cash & Bank Lines Bank Line Usage • Excess liquidity of $2 billion at the end of third quarter 2006 • Pro forma for additional $1 billion credit facility, excess liquidity at the end of the third quarter 2006 of more than $3 billion (1) Excludes $2.5 billion bridge facility 26 (2) Pro Forma for $1 billion bank line established on 10/24/2006
- 27. Balance Sheet Actual 6/30/06 9/30/06 ($ in billions) Debt Total Debt $4.9 $4.8 Less: Cash (0.2) (0.3) Net Debt 4.7 4.4 Capital 50% Trust Preferred $0.1 $0.1 Equity 4.4 4.5 (1) Add Back: AOCI Balance 1.2 1.3 (2) Total Capital $10.4 $10.4 3rd Party Cash Collateral 0.2 0.3 Adjusted Net Debt to Adjusted Total Capital 45.9% 44.3% (3) (1) Includes preferred stock and minority interest (2) Related to cash flow hedges of commodity transactions (3) Excludes AOCI Balance related to cash flow hedges of commodity transactions and 3rd Party Cash Collateral See Appendix 27
- 28. Credit Metrics Projected (1) Actual 12/31/01 12/31/03 12/31/05 12/31/06 Adjusted Net Debt 54.8% 50.6% 43.7% 40 % to Capital (2) Excess Liquidity $0.6 $1.9 $2.1 $3.0+ ($ billions) • S&P upgraded CEG senior unsecured debt rating to BBB+ • Credit metrics continue to strengthen • Additional liquidity provided by $1 billion credit facility activated upon termination of merger with FPL (1) Assumes sale of gas-fired merchant plants completed by FYE 2006 (2) Net debt adjusted to exclude 3rd party collateral. Total capital adjusted to exclude AOCI balance related to cash flow hedges of commodity transactions, 3rd party collateral and AOCI balance related to changes in pension and post-retirement accounting See Appendix 28
- 29. Projected 2007 Merchant Gross Margin & EBITDA Gross Margin EBITDA (1) (1) ($ millions) Mid-Atlantic Fleet $ 1,000 - 1,150 $ 600 - 700 Plants with PPAs 575 - 675 300 - 350 Wholesale Competitive Supply 800 - 1,000 500 - 600 NewEnergy 435 - 505 140 - 165 QFs/Other 40 - 50 15 - 20 Total Merchant 3,050 - 3,250 1,650 - 1,750 Negative Impact of Hedges 900 - 950 900 - 950 (2) Total Merchant - Unhedged $ 3,950 - 4,200 $2,550 - 2,700 NPV of Hedges (2) (2,600) - (2,650) NOTE: The Merchant Segment is managed using an integrated portfolio approach. To support investors’ analytical work, Constellation has made assumptions on the allocation of costs and expenses to the various components of the Merchant Segment in order to support analytics around valuation. All calculations exclude High Desert Gas Plant. (1) Includes Nuclear Fuel Amortization for Mid-Atlantic Fleet and Plants with PPAs (2) Represents hedges on Mid-Atlantic Fleet and Plants with PPAs 29
- 30. Long-term Earnings Outlook Actual Guidance 2007 (1) ($ per share) 2005 2006 2008 GAGR Prior Adjusted Earnings (2) $3.28 $3.35 - $3.65 $4.40 – $4.65 $5.25 - $5.75 17% - 21% (2) Adjusted Earnings 3.28 3.65 – 3.80 4.40 - 4.65 5.25 - 5.75 17% - 21% High Desert (0.38) (0.34) (0.10) - Adjusted Earnings $2.90 $3.30 - $3.45 $4.30 - $4.65 $5.25 - $5.75 22% - 26% excluding High Desert (3) (1) Preliminary guidance (2) Excludes special items, certain economic, non-qualifying hedges and synfuel earnings (3) Excludes special items, certain economic, non-qualifying hedges and synfuel earnings, and High Desert earnings, which will be classified as discontinued operations See Appendix 30
- 31. Q4 2006 Earnings Per Share Guidance Guidance Actual Q4 2006 Q4 2005 ($ per share) Merchant $0.55 - $0.70 $0.62 Merchant including High Desert 0.65 – 0.80 0.72 BGE 0.19 – 0.25 0.25 Other 0.01 – (0.01) - Adjusted Earnings Per Share $0.75 - $0.90 $0.87 (1) Adjusted Earnings Per Share including High Desert (2) $0.85 - $1.00 $0.97 Synfuels $0.04 $0.10 (1)Excludes special items, certain economic, non-qualifying hedges and synfuel earnings, and High Desert earnings, which will be classified as discontinued operations (2)Excludes special items, certain economic, non-qualifying hedges and synfuel earnings See Appendix 31
- 33. Gas-fired Plants – Divestiture Accounting • Financial statement impacts in Q4 2006 – all plants classified as held for sale – All assets and liabilities to be disposed will be reclassified as current in the balance sheet – Depreciation discontinued immediately – Hedge accounting discontinued immediately, and prior deferred hedge gains or losses removed from accumulated other comprehensive income (equity) and recognized in earnings • Presentation of operations beginning in Q4 2006 – High Desert – discontinued operations (determined to be a component for which cash flows and operations will be eliminated) Single income statement line item including both operating results and gain on sale All prior periods in the income statement will be reclassified to conform – Other plants not classified as discontinued operations (due to the lack of separately identifiable cash flows and sales of a commodity in a liquid market) Operations prior to closing and gain on sale reported in operating results Divestiture will affect financial statements beginning in Q4 2006 33
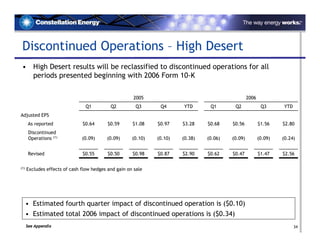
- 34. Discontinued Operations – High Desert • High Desert results will be reclassified to discontinued operations for all periods presented beginning with 2006 Form 10-K 2005 2006 Q1 Q2 Q3 Q4 YTD Q1 Q2 Q3 YTD Adjusted EPS As reported $0.64 $0.59 $1.08 $0.97 $3.28 $0.68 $0.56 $1.56 $2.80 Discontinued Operations (1) (0.09) (0.09) (0.10) (0.10) (0.38) (0.06) (0.09) (0.09) (0.24) Revised $0.55 $0.50 $0.98 $0.87 $2.90 $0.62 $0.47 $1.47 $2.56 (1) Excludes effects of cash flow hedges and gain on sale • Estimated fourth quarter impact of discontinued operation is ($0.10) • Estimated total 2006 impact of discontinued operations is ($0.34) See Appendix 34
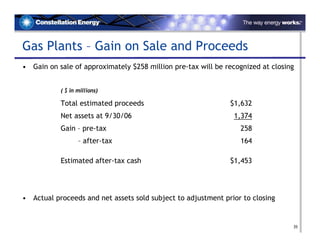
- 35. Gas Plants – Gain on Sale and Proceeds • Gain on sale of approximately $258 million pre-tax will be recognized at closing ( $ in millions) Total estimated proceeds $1,632 Net assets at 9/30/06 1,374 Gain – pre-tax 258 – after-tax 164 Estimated after-tax cash $1,453 • Actual proceeds and net assets sold subject to adjustment prior to closing 35
- 36. Collateral Positions Q3 Change vs. Change Year-End 12/31/05 6/30/06 9/30/06 B / (W) B / (W) ($ in millions) Cash Collateral Held $(401) $(167) $(321) $154 $(80) Collateral Posted Exchanges $285 $543 $762 ($219) ($477) 3rd Parties 86 166 185 (19) (99) Subtotal Posted 371 709 947 (238) (576) Net Cash Posted Subtotal (30) 542 626 (84) (656) Letters of Credit Posted $2,486 $1,802 $1,835 $(33) 651 Change in Total Collateral Posted ($5) Shift from letters of credit to cash collateral has had little impact on our liquidity 36
- 37. Synfuel Update (1) YTD 2006 2007 Q3 2006 09/30/06 Estimate Estimate ($ in millions, except per share amounts) Pre-phase-out: Pre-tax loss on production ($12) ($67) ($94) ($111) Tax benefit of pre-tax loss 5 25 35 42 Tax credits before phase-out 15 91 129 142 Net income pre-phase-out $8 $50 $71 $72 Impact of phase-out Tax credit phase-out percentage 42% 42% 42% Production expenses, net of tax - $9 $11 $10 Current period credit phase-out (6) (37) (53) (58) Phase-out catch-up prior quarters 19 - - - Net income impact of phase-out $13 ($28) ($42) ($48) $20 $22 $29 $24 Net synfuels income Net synfuel EPS $0.11 $0.12 $0.16 $0.14 (1) Numbers may not sum due to rounding 37
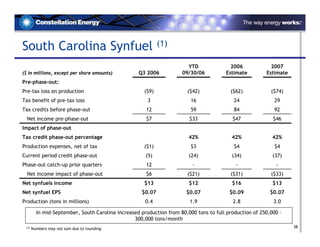
- 38. South Carolina Synfuel (1) YTD 2006 2007 Q3 2006 09/30/06 Estimate Estimate ($ in millions, except per share amounts) Pre-phase-out: Pre-tax loss on production ($9) ($42) ($62) ($74) Tax benefit of pre-tax loss 3 16 24 29 Tax credits before phase-out 12 59 84 92 Net income pre-phase-out $7 $33 $47 $46 Impact of phase-out Tax credit phase-out percentage 42% 42% 42% Production expenses, net of tax ($1) $3 $4 $4 Current period credit phase-out (5) (24) (34) (37) - Phase-out catch-up prior quarters 12 - - ($31) Net income impact of phase-out $6 ($21) ($33) Net synfuels income $13 $12 $16 $13 Net synfuel EPS $0.07 $0.07 $0.09 $0.07 Production (tons in millions) 0.4 1.9 2.8 3.0 In mid-September, South Carolina increased production from 80,000 tons to full production of 250,000 – 300,000 tons/month 38 (1) Numbers may not sum due to rounding
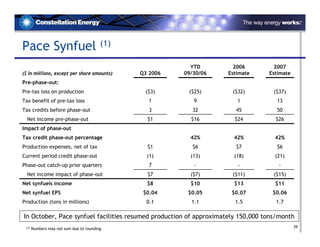
- 39. Pace Synfuel (1) YTD 2006 2007 Q3 2006 09/30/06 Estimate Estimate ($ in millions, except per share amounts) Pre-phase-out: Pre-tax loss on production ($3) ($25) ($32) ($37) Tax benefit of pre-tax loss 1 9 1 13 Tax credits before phase-out 3 32 45 50 Net income pre-phase-out $1 $16 $24 $26 Impact of phase-out Tax credit phase-out percentage 42% 42% 42% Production expenses, net of tax $1 $6 $7 $6 Current period credit phase-out (1) (13) (18) (21) Phase-out catch-up prior quarters 7 - - - Net income impact of phase-out $7 ($7) ($11) ($15) Net synfuels income $8 $10 $13 $11 Net synfuel EPS $0.04 $0.05 $0.07 $0.06 Production (tons in millions) 0.1 1.1 1.5 1.7 In October, Pace synfuel facilities resumed production of approximately 150,000 tons/month 39 (1) Numbers may not sum due to rounding
- 41. Summary of Non-GAAP Measures Slide(s) Where Used Slide Containing Non-GAAP Measure in Presentation Most Comparable GAAP Measure Reconciliation Adjusted EPS Reported GAAP EPS Q306 Actual 5, 13, 14, 15, 16 42 Q305 Actual 5, 13, 14, 15, 16 42 EPS Guidance 5, 11, 13, 14, 15, 16, 30, 31 42 2005 YTD Actual 11, 30 43 Q1, Q2, Q3, and 9 months 06 Actual 34 43 Q1, Q2, Q3, and Q4 05 Actual 34 43 Q405 Actual 31 44 Q306 Merchant Gross Margin 17, 18 Income from Operations / Net Income 45 Q305 Merchant Gross Margin 17, 18 46 Q306 Merchant Below Gross Margin 17 45 Q305 Merchant Below Gross Margin 17 46 Net Cash Flow before Debt Issuances/(Payments) 25 Operating, Investing and Financing Cash Flow 47 Free Cash Flow 25 47 Debt to Total Capital 27, 28 Debt Divided by Total Capitalization 48 Projected Debt to Total Capital 28 48 41
- 42. Adjusted EPS Q306 and Q305 We exclude special items and certain economic, non-qualifying fuel adjustment clause and gas transportation and storage hedges because we believe that it is appropriate for investors to consider results excluding these items, in addition to our results in accordance with GAAP. We have also adjusted earnings to exclude synfuel results due to the potential volatility and phase-out of the tax credits. We believe such a measure provides a picture of our results that is comparable among periods since it excludes the impact of items, which may recur occasionally, but tend to be irregular as to timing and magnitude, thereby distorting comparisons between periods. However, investors should note that this non-GAAP measure involve judgment by management (in particular, judgments as to what is or is not classified as a special item). We also use this measure to evaluate performance and for compensation purposes. RECONCILIATION: Merchant Regulated Regulated Other Energy Electric Gas BGE Nonreg. Total A B C D = (B+C) E F =(A+D+E) 3Q06 ACTUAL RESULTS: Reported GAAP EPS $ 1.57 $ 0.24 $ (0.04) $ 0.20 $ 0.02 $ 1.79 GAAP MEASURE Special Items, Non-qualifying Hedges, and Synfuel Results Included in Operations: Non-qualifying hedges 0.20 - - - - 0.20 Synthetic fuel facility results 0.11 - - - - 0.11 Workforce reduction costs (0.07) - - - - (0.07) Merger-related costs (0.01) - - - - (0.01) Total Special Items, Non-qualifying Hedges, and Synfuel Results 0.23 - - - - 0.23 Adjusted EPS $ 1.34 $ 0.24 $ (0.04) $ 0.20 $ 0.02 $ 1.56 NON-GAAP MEASURE 3Q05 ACTUAL RESULTS: Reported GAAP EPS $ 0.78 $ 0.28 $ (0.04) $ 0.24 $ 0.01 $ 1.03 Income from Discontinued Operations - - - - 0.01 0.01 GAAP MEASURES EPS Before Discontinued Operations 0.78 0.28 (0.04) 0.24 - 1.02 Special Items, Non-qualifying Hedges, and Synfuel Results Included in Operations: Non-qualifying hedges (0.13) - - - - (0.13) Synthetic fuel facility results 0.08 - - - - 0.08 Workforce reduction costs (0.01) - - - - (0.01) Total Special Items, Non-qualifying Hedges, and Synfuel Results (0.06) - - - - (0.06) Adjusted EPS $ 0.84 $ 0.28 $ (0.04) $ 0.24 $ - $ 1.08 NON-GAAP MEASURE EARNINGS GUIDANCE Constellation Energy is unable to reconcile its earnings guidance excluding special items, non-qualifying hedges, and synfuel results to GAAP earnings per share because we do not predict the future impact of special items such as the cumulative effect of changes in accounting 42 principles, the disposition of assets, economic, nonqualifying hedges or synfuel results.
- 43. Adjusted EPS – Prior Periods We exclude special items and certain economic, non-qualifying fuel adjustment clause and gas transportation and storage hedges because we believe that it is appropriate for investors to consider results excluding these items, in addition to our results in accordance with GAAP. We have also adjusted earnings to exclude synfuel results due to the potential volatility and phase-out of the tax credits. We believe such a measure provides a picture of our results that is comparable among periods since it excludes the impact of items, which may recur occasionally, but tend to be irregular as to timing and magnitude, thereby distorting comparisons between periods. However, investors should note that this non-GAAP measure involve judgment by management (in particular, judgments as to what is or is not classified as a special item). We also use this measure to evaluate performance and for compensation purposes. RECONCILIATION: 2005 YTD Q1 05 Q2 05 Q3 05 Q4 05 Total Q1 06 Q2 06 Q3 06 Sept 06 ACTUAL RESULTS: Reported GAAP EPS $ 0.68 $ 0.68 $ 1.03 $ 1.09 $ 3.47 $ 0.63 $ 0.52 $ 1.79 $ 2.94 Income from Discontinued Operations - High Desert 0.09 0.09 0.10 0.10 0.38 0.06 0.09 0.09 0.24 GAAP MEASURES Income from Discontinued Operations - Others 0.01 0.02 0.01 0.09 0.13 - - - 0.01 Cumulative Effects of Changes in Accounting Principles - - - (0.04) (0.04) - - - - EPS Before Discontinued Operations and Cumulative Effects of Changes in Accounting Principles 0.58 0.57 0.92 0.94 3.00 0.57 0.43 1.70 2.69 Special Items and Non-qualifying Hedges Included in Operations: Non-qualifying hedges (0.04) (0.02) (0.13) 0.06 (0.14) (0.06) - 0.20 0.14 Merger related transaction costs - - - (0.09) (0.09) (0.01) (0.03) (0.01) (0.05) Workforce reduction costs - - (0.01) - (0.01) - - (0.07) (0.08) Total Special Items and Non-qualifying Hedges (0.04) (0.02) (0.14) (0.03) (0.24) (0.07) (0.03) 0.12 0.01 Adjusted EPS 0.62 0.59 1.06 0.97 3.24 0.64 0.46 1.58 2.68 NON-GAAP MEASURE Synthetic fuel facility earnings 0.07 0.09 0.08 0.10 0.34 0.02 (0.01) 0.11 0.12 Adjusted EPS excluding Synfuel results $ 0.55 $ 0.50 $ 0.98 $ 0.87 $ 2.90 $ 0.62 $ 0.47 $ 1.47 $ 2.56 NON-GAAP MEASURE 43
- 44. Adjusted EPS 4Q05 We exclude special items and certain economic, non-qualifying fuel adjustment clause and gas transportation hedges because we believe that it is appropriate for investors to consider results excluding these items, in addition to our results in accordance with GAAP. We have also adjusted earnings to exclude synfuel results due to the potential volatility and phase-out of the tax credits. We believe such a measure provides a picture of our results that is comparable among periods since it excludes the impact of items, which may recur occasionally, but tend to be irregular as to timing and magnitude, thereby distorting comparisons between periods. However, investors should note that this non-GAAP measures involve judgment by management (in particular, judgments as to what is or is not classified as a special item). We also use these measures to evaluate performance and for compensation purposes. RECONCILIATION: Merchant Regulated Regulated Other Energy Electric Gas BGE Nonreg. Total A B C D = (B+C) E F =(A+D+E) 4Q05 ACTUAL RESULTS: Reported GAAP EPS $ 0.78 $ 0.17 $ 0.05 $ 0.22 $ 0.09 $ 1.09 Income from Discontinued Operations * 0.10 - - - 0.09 0.19 GAAP MEASURES Cumulative Effects of Changes in Accounting Principles (0.04) - - - - (0.04) EPS Before Discontinued Operations and Cumulative 0.72 0.17 0.05 0.22 - 0.94 Special Items, Non-qualifying Hedges, and Synfuel Results Included in Operations: Synthetic fuel facility results 0.10 - - - - 0.10 Non-qualifying hedges 0.06 - - - - 0.06 Merger related transaction costs (0.06) (0.02) (0.01) (0.03) - (0.09) Total Special Items and Non-qualifying Hedges 0.10 (0.02) (0.01) (0.03) - 0.07 Adjusted EPS $ 0.62 $ 0.19 $ 0.06 $ 0.25 $ - $ 0.87 NON-GAAP MEASURE * Merchant includes the reclassification of High Desert to Discontinued Operations 44
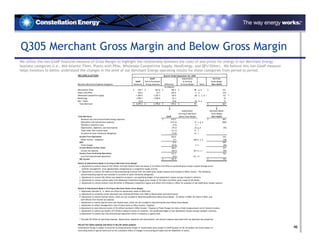
- 45. Q306 Merchant Gross Margin and Below Gross Margin We utilize the non-GAAP financial measure of Gross Margin to highlight the relationship between the costs of and prices for energy in our Merchant Energy business categories (i.e., Mid-Atlantic Fleet, Plants with PPAs, Wholesale Competitive Supply, NewEnergy, and QFs/Other). We believe this non-GAAP measure helps investors to better understand the changes in the level of our Merchant Energy operating results for these categories from period to period. RECONCILIATION: Quarter Ended September 30, 2006 GAAP Adjustments Merchant GAAP Fuel & Purchased In Arriving Gross Margin Merchant Revenue & Expense Categories Revenues Energy Expenses Difference At Gross Margin Notes (Non-GAAP) ($ millions) Mid-Atlantic Fleet $ 1,002.2 $ 605.3 $ 396.9 $ (112) a, b, c $ 285 Plants with PPAs 255.0 16.8 238.2 (11) a 227 Wholesale Competitive Supply 1,668.9 1,469.0 199.9 88 a , d, e 288 ** NewEnergy 2,094.8 1,964.9 129.9 (20) d 109 QFs / Other 28.1 - 28.1 (7) e, f 22 Total Merchant $ 5,049.0 $ 4,056.0 $ 993.0 $ (62) $ 931 Adjustments Merchant Below Arriving At Merchant Gross Margin Total Merchant: GAAP Below Gross Margin (Non-GAAP) Revenues less fuel and purchased energy expenses $ 993.0 $ 931 Operations and maintenance expenses (372.6) 11 g, h, i (362) Workforce reduction costs (21.7) 22 j - Merger-related costs (2.5) 3 j - Depreciation, depletion, and amortization (72.9) (2) h, i (75) Taxes other than income taxes (32.6) 33 k - Accretion of asset retirement obligations (17.1) 17 k - Income From Operations 473.6 494 Other income / (expense) 3.8 (43) b, k, l (39) EBIT N/A 455 Fixed charges (51.1) (0) i, l (52) Income Before Income Taxes 426.3 403 Income tax expense (141.5) (18) i, j, m (159) Net Income $ 284.8 $ 244 Details of Adjustments Made in Arriving at Merchant Gross Margin: a Adjustment to remove ($115 million) gain from Mid-Atlantic Fleet and ($11 million) gain from Plants with PPA's of estimated gross margin created through active portfolio management more appropriately categorized as a competitive supply activity. b Adjustment to remove ($5 million) of decommissioning revenues from non-GAAP gross margin measure and included in Other Income. The offsetting decommissioning expense was recorded in accretion of asset retirement obligations. c Adjustment to remove $8 million of other indirect costs from non-GAAP gross margin as they are more appropriately categorized as operating expenses. d Adjustment to remove ($39 million) gain in Wholesale Competitive Supply and ($20 million) gain in NewEnergy related to economic, non-qualifying hedges of gas transport contracts. e Adjustment to remove synfuel losses from Wholesale Competitive Supply gross margin of $1 million and Other gross margin of $3 million. f Adjustment to reflect ($10 million) of direct costs in Other for purposes of non-GAAP gross margin measure. Details of Adjustments Made in Arriving at Merchant Below Gross Margin: g Adjustment detailed in quot;cquot; and quot;fquot; above are offset by adjustments made to O&M costs. h Adjustment to reclassify certain allocated costs totaling $8 million from O&M to Depreciation and Amortization. i Adjustment to remove Synfuel results, which are not included in determining Merchant Below Gross Margin - $1 million in O&M, $6 million in D&A, $2 million in Fixed Charges, and ($32 million) from income tax expense. j Adjustment to remove Special Items and related taxes, which are not included in determining Merchant Below Gross Margin. k Adjustment to reflect management's view of these items as Other Income / Expense. l Adjustment to move Interest Income of $2 million recorded in Other Income / Expense to Fixed Charges (to show a fixed charge amount net of interest income). m Adjustment to remove tax expense of $23 million related to gains on economic, non-qualifying hedges of gas transportation and storage contracts. ** Excludes $13 million of operating expenses, depreciation, depletion and amortization, and interest expense associated with our Upstream Gas properties PROJECTED GROSS MARGIN AND RESULTS BELOW GROSS MARGIN: 45 Constellation Energy is unable to reconcile its projected gross margin or results below gross margin to GAAP because we do not predict the future impact of reconciling items or special items such as the cumulative effect of changes in accounting principles and the disposition of assets.
- 46. Q305 Merchant Gross Margin and Below Gross Margin We utilize the non-GAAP financial measure of Gross Margin to highlight the relationship between the costs of and prices for energy in our Merchant Energy business categories (i.e., Mid-Atlantic Fleet, Plants with PPAs, Wholesale Competitive Supply, NewEnergy, and QFs/Other). We believe this non-GAAP measure helps investors to better understand the changes in the level of our Merchant Energy operating results for these categories from period to period. RECONCILIATION: Quarter Ended September 30, 2005 GAAP Adjustments Merchant GAAP Fuel & Purchased In Arriving Gross Margin Merchant Revenue & Expense Categories Revenues Energy Expenses Difference At Gross Margin Notes (Non-GAAP) ($ millions) Mid-Atlantic Fleet $ 746.7 $ 563.8 $ 182.9 $ 48 a, b $ 231 Plants with PPAs 254.6 23.7 230.9 3 a 234 Wholesale Competitive Supply 1,383.0 1,252.5 130.5 (8) a , c, d, e 123 ** NewEnergy 1,990.1 1,938.0 52.1 - 52 QFs / Other 22.8 - 22.8 (2) d, e 21 Total Merchant $ 4,397.2 $ 3,778.0 $ 619.2 $ 41 $ 661 Adjustments Merchant Below Arriving At Merchant Gross Margin Total Merchant: GAAP Below Gross Margin (Non-GAAP) Revenues less fuel and purchased energy expenses $ 619.2 $ 661 Operations and maintenance expenses (273.4) 13 f, g, h (260) Workforce reduction costs (3.9) 4 i Depreciation, depletion, and amortization (74.3) (2) g, h (76) Taxes other than income taxes (31.3) 31 j - Accretion of asset retirement obligations (15.8) 16 j - Income From Operations 220.5 325 Other income / (expense) 9.7 (46) b, j, k (38) EBIT N/A 287 Fixed charges (43.8) 4k (40) Income Before Income Taxes 186.4 247 Income tax expense (44.7) (51) h, i, l (95) Income from Continuing Operations 141.7 152 Loss from discontinued operations (0.2) 0.2 m - Net Income $ 141.5 $ 152 Details of Adjustments Made in Arriving at Merchant Gross Margin: a Adjustment to remove losses of $53 million from Mid-Atlantic Fleet and losses of $3 million from PPAs of estimated gross margin created through active portfolio management more appropriately categorized as a competitive supply activity. b Adjustment to remove ($5 million) of decommissioning revenues from non-GAAP gross margin measure and included in Other Income. The offsetting decommissioning expense was recorded in accretion of asset retirement obligations. c Adjustment to remove $36 million loss related to economic, non-qualifying hedges of fuel adjustment clauses and gas transport contracts. d Adjustment to remove synfuel losses from Wholesale Competitive Supply gross margin of $5 million and Other gross margin of $8 million. e Adjustment to remove indirect costs $8 million in Wholesale Competitive Supply and reflect ($10 million) in Other for purposes of non-GAAP gross margin measure. Details of Adjustments Made in Arriving at Merchant Below Gross Margin: f Adjustment detailed in quot;equot; above are offset by adjustments made to O&M costs. g Adjustment to reclassify certain allocated costs totaling $8 million from O&M to Depreciation and Amortization. h Adjustment to remove Synfuel results, which are not included in determining Merchant Below Gross Margin - $2 million in O&M, $6 million in D&A, and ($34 million) from income tax expense. i Adjustment to remove Special Items and related taxes, which are not included in determining Merchant Below Gross Margin. j Adjustment to reflect management's view of these items as Other Income / Expense. k Adjustment to move Interest Income of $4 million recorded in Other Income / Expense to Fixed Charges (to show a fixed charge amount net of interest income). l Adjustment to remove tax benefit ($15 million) related to losses on economic, non-qualifying hedges of fuel adjustment clauses and gas transport contracts. m Adjustment to remove loss from discontinued operations which is treated as a special item. ** Excludes $8 million of operating expenses, depreciation, depletion and amortization, and interest expense associated with our Upstream Gas properties PROJECTED GROSS MARGIN AND RESULTS BELOW GROSS MARGIN: 46 Constellation Energy is unable to reconcile its projected gross margin or results below gross margin to GAAP because we do not predict the future impact of reconciling items or special items such as the cumulative effect of changes in accounting principles and the disposition of assets.
- 47. Cash Flows The following is a reconciliation of the non-GAAP financial measures of Net Cash Flow before Debt Issuances/Payments and Free Cash Flow for the nine months ended September 30, 2006. We utilize these non-GAAP measures because we believe they are helpful in understanding our ability to reduce debt by existing cash. RECONCILIATION: 2006 ($ millions) QTD SEPTEMBER ACTUAL RESULTS: Net cash used in operating activities (GAAP measure) 582 Adjustment for derivative contracts presented as financing activities under SFAS 149 (5) Adjusted Net Cash Used in Operating Activities $ 577 NON-GAAP MEASURE Net cash used in investing activities (GAAP measure) (300) Net Cash Used in Financing Activities (Excl. Debt-Related Sources & Uses) * Common stock dividends paid (68) Proceeds from issuance of common stock 15 Net proceeds from acquired contracts - Other financing activities, excluding SFAS 149 activities included in operating 1 Adjusted Net Cash Used in Financing Activities (52) Net Cash Flow before Debt Issuances/(Payments) 225 NON-GAAP MEASURE Less: Proceeds from issuance of common stock (15) Add: Common stock dividends paid 68 Free Cash Flow $ 278 NON-GAAP MEASURE * Total GAAP Cash Used in Financing Activities (incl. debt-related sources & uses) was $189 million QTD SEPTEMBER 06. PROJECTED CASH FLOWS: Constellation Energy is unable to provide a reconciliation of these measures for Projected 2006 because it does not prepare a forecasted statement of cash flows on a GAAP basis. 47

