Contoh Presentasi Pembelajaran Berbasis Riset (PBR) Mata Kuliah Pemodelan Sistem
- 1. SYSTEM MODELLING PROJECT - Aisha Adilla - Givanny Permata Sari - Hanny Riana - Latifa Ayu Lestari - Salma Nabila Hadi - Sarah Marsha Davinna SquadBPJ
- 2. • BPJSquad consists of 6 female students from the Department of Industrial Engineering, Universitas Indonesia. This team was formed for the project of Systems Modeling class taught by Mr. Arry Rahmawan. In this project, we were asked to do research on the system of the BPJS Program in a public hospital, in our case RSUD Pasar Minggu. Salma Nabila Givanny Permata Latifa Ayu Aisha Adilla Sarah Marsha Hanny Riana TEAM PROFILE SquadBPJ
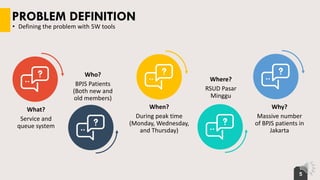
- 5. What? Service and queue system PROBLEM DEFINITION Who? BPJS Patients (Both new and old members) When? During peak time (Monday, Wednesday, and Thursday) Where? RSUD Pasar Minggu Why? Massive number of BPJS patients in Jakarta 5 • Defining the problem with 5W tools
- 6. 6 PROBLEM DEFINITION • Defining the hypothesis of the problem And how it will affects? If the management of RSUD Pasar Minggu ignores this problem, the BPJS patient will feel uncomfortable while treating their disease in this hospital due to dissatisfaction of the hospital’s BPJS system. What are the symptoms? Since RSUD Pasar Minggu has accepted BPJS patients, there have been problems in the form of a massive amount of BPJS patients resulting in a long queueing time in the registration, polyclinic, and pharmacy lines that makes patients dissatisfied.
- 7. 7 RESEARCH OBJECTIVES • Defining the objectives of our research project • Reducing the queuing time of BPJS at RSUD Pasar Minggu • Reducing the service time of BPJS at RSUD Pasar Minggu • Increasing customer satisfaction • Answering the questions that have been given in class
- 8. 02 • Representing the real BPJS system at RSUD Pasar Minggu as a flowchart MODEL CONCEPTUALIZATION
- 11. DATA COLLECTION
- 12. DATA COLLECTION • Explaining the data collection method and the data types 12 Direct observation Interview Direct Measurement Books / Journals
- 13. Inter-arrival Time 13 DATA COLLECTION • Explaining about the data that we collected Arrival Rate Service Time and Service Rate Queue Time Registration Time
- 14. DATA COLLECTION • Explaining how we know the peak days of the system and the sampling method 14 We used direct observation and interview to know what the peak days are of the BPJS system at RSUD Pasar Minggu From direct observation, we got Monday, Wednesday, and Thursday as a peak day. This was also proven by the result of interviews with hospital management. The average population observed in Monday, Wednesday, and Thursday is 222 patients (the population from polyclinics are most influential). We get 144 samples from Slovin’s Formula. We used stratified random sampling because the difference of cumulative from each registration and polyclinic. Stratified Random Sampling From 144 samples, Registration Samples • BPJS Lama= 84% from population (121 patients) • BPJS Baru= 16% from population (23 patients) Polyclinics Samples • Penyakit Dalam= 44% from population (63 patients) • Jantung= 36% from population (51 patients) • Syaraf= 20% from population (29 patients)
- 15. • Based on direct observation (service time and arrival rate), 80% of the service time and arrival rate comes from 20% of the polyclinics: Penyakit Dalam, Jantung, and Syaraf DATA COLLECTION • Using pareto diagram to know which polyclinic should be observed 15 0% 20% 40% 60% 80% 100% 120% 0% 5% 10% 15% 20% 25% 30% 35% 40% Jumlah Kedatangan Per Periode Waktu % Kumulatif % 0% 20% 40% 60% 80% 100% 120% 0% 5% 10% 15% 20% 25% Waktu Pelayanan % Kumulatif %
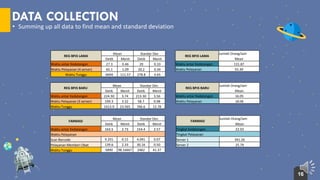
- 16. DATA COLLECTION • Summing up all data to find mean and standard deviation 16 REG BPJS LAMA Mean Standar Dev Detik Menit Detik Menit Waktu antar Kedatangan 27.3 0.46 20 0.33 Waktu Pelayanan (4 server) 65.1 1.09 20.2 0.34 Waktu Tunggu 6694 111.57 278.8 4.65 REG BPJS LAMA Jumlah Orang/Jam Mean Waktu antar Kedatangan 131.87 Waktu Pelayanan 55.30 REG BPJS BARU Mean Standar Dev Detik Menit Detik Menit Waktu antar Kedatangan 224.30 3.74 213.30 3.56 Waktu Pelayanan (3 server) 199.3 3.32 58.7 0.98 Waktu Tunggu 1413.9 23.565 766.6 12.78 REG BPJS BARU Jumlah Orang/Jam Mean Waktu antar Kedatangan 16.05 Waktu Pelayanan 18.06 FARMASI Mean Standar Dev Detik Menit Detik Menit Waktu antar Kedatangan 163.5 2.73 154.4 2.57 Waktu Pelayanan Scan Barcode 9.201 0.15 4.091 0.07 Pelayanan Memberi Obat 139.6 2.33 30.16 0.50 Waktu Tunggu 5890 98.16667 2482 41.37 FARMASI Jumlah Orang/Jam Mean Tingkat Kedatangan 22.02 Tingkat Pelayanan Server 1 391.26 Server 2 25.79
- 17. DATA COLLECTION • Summing up all data to find mean and standard deviation 17 POLI JANTUNG Mean Standar Dev Detik Menit Detik Menit Waktu antar Kedatangan 178 2.97 116 1.93 Waktu Pelayanan (2 server) 330.4 5.51 56.8 0.95 Waktu Tunggu 9204 153.4 1796 29.93 POLI JANTUNG Jumlah Orang/Jam Mean Tingkat Kedatangan 20.22 Tingkat Pelayanan 10.90 POLI PENYAKIT DALAM Mean Standar Dev Detik Menit Detik Menit Waktu antar Kedatangan 160.1 2.67 163.6 2.73 Waktu Pelayanan (2 server) 578.7 9.65 192.1 3.20 Waktu Tunggu 4349 72.48 1893 31.55 POLI PENYAKIT DALAM Jumlah Orang/Jam Mean Waktu antar Kedatangan 22.49 Waktu Pelayanan 6.22 POLI SYARAF Mean Standar Dev Detik Menit Detik Menit Waktu antar Kedatangan 233.28 3.89 197.66 3.29 Waktu Pelayanan (2 server) 333.3 5.56 55.57 0.93 Waktu Tunggu 4526.0 75.43 695.80 11.60 POLI SYARAF Jumlah Orang/Jam Mean Tingkat Kedatangan 15.43 Tingkat Pelayanan 10.80
- 18. DATA ANALYSIS
- 19. DATA ANALYSIS • Identifying the type of distribution of each data 19 Normal Normal BPJS Lama Inter-arrival TimeServiceTime
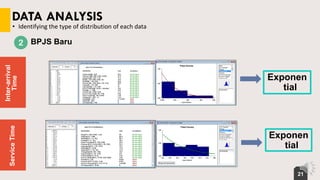
- 21. DATA ANALYSIS 21 Exponen tial Exponen tial BPJS Baru • Identifying the type of distribution of each data Inter-arrival TimeServiceTime
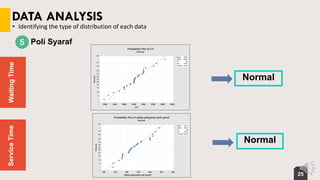
- 23. DATA ANALYSIS 23 Normal Normal Poli Penyakit Dalam • Identifying the type of distribution of each data WaitingTimeServiceTime
- 24. DATA ANALYSIS • Identifying the type of distribution of each data 24 Normal Normal Poli Jantung WaitingTimeServiceTime
- 28. 04 • Illustrating about how a ProModel model is built to represent the real system MODEL CONSTRUCTION
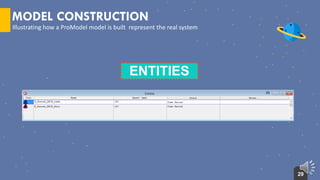
- 29. MODEL CONSTRUCTION Illustrating how a ProModel model is built represent the real system 29 ENTITIES
- 30. MODEL CONSTRUCTION 30 Illustrating how a ProModel model is built represent the real system LOCATIONS
- 31. MODEL CONSTRUCTION 31 Illustrating how a ProModel model is built represent the real system ARRIVALS
- 36. MODEL CONSTRUCTION 36 Illustrating how a ProModel model is built represent the real system • Final ProModel for the BPJS system of RSUD Pasar Minggu When model pause When model run
- 38. VALIDATION
- 39. VALIDATION • Model conceptualization validation 39 Trace Validity Face Validity Trace in Promodel Using a feature in ProModel (trace) to trace the truth of the model logic and computer model (debugging) Validity in Real Life Checking the validity of model conceptualization by asking people who know the system well and trusted Determining the truth of model flow diagram or model logic mechanism
- 41. VALIDATION • Model conceptualization validation 41 We interviewed people from information centre and also security who is on duty and always observe the queuing system of BPJS patients in RSUD Pasar MingguFace Validity Interview recording attached
- 42. VALIDATION • ProModel validation 42 Comparing with Queuing Theory Watching the Animation Extreme Condition Test Running Traces Comparing output from the simulation with queuing theory Watching the computer model that has conducted Testing the model using 2 extreme conditions Stage of processes are traced using the processing logic model to be compared with the actual model
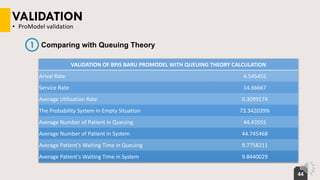
- 43. VALIDATION • ProModel validation 44 Comparing with Queuing Theory VALIDATION OF BPJS BARU PROMODEL WITH QUEUING THEORY CALCULATION Arival Rate 4.545455 Service Rate 14.66667 Average Utilization Rate 0.3099174 The Probability System in Empty Situation 73.342039% Average Number of Patient in Queuing 44.43555 Average Number of Patient in System 44.745468 Average Patient’s Waiting Time in Queuing 9.7758211 Average Patient’s Waiting Time in System 9.8440029
- 44. VALIDATION • ProModel validation 45 Watching the Animation
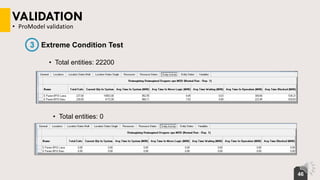
- 45. VALIDATION • ProModel validation 46 • Total entities: 22200 Extreme Condition Test • Total entities: 0
- 46. VALIDATION • ProModel validation 47 Running Traces
- 47. VERIFICATION
- 48. VERIFICATION • Model verification 49 Watching the Animation Using Trace and Debugging Facilities Reviewing the Model Code Visual verification whether the model running has been right Checking for code errors or inconsistency in the statistics results • Trace : chronologically describe what’s happening during the simulation • Debugger : showing the stages of the processes in the simulation • Trace & Debugger enable us to look deeper what’s happening in the simulation
- 49. VERIFICATION • Model verification 50 Watching the Animation
- 50. VERIFICATION • Model verification 51 Reviewing the Model Code
- 51. VERIFICATION • Model verification 52 Reviewing the Model Code (cont’d)
- 52. VERIFICATION • Model verification 53 Reviewing the Model Code (cont’d)
- 53. VERIFICATION • Model verification 54 Reviewing the Model Code (cont’d) (1) (2)
- 54. VERIFICATION • Model verification 55 • There are no bugs, so the model can run perfectly Running Trace and Debugging Facilities
- 60. ANSWER TO THE 1ST QUESTION 61 • What is the best line formation? • Single Line -> Multi Server SquadBPJ
- 61. 62 • Where are the worst bottlenecks of system? SquadBPJANSWER TO THE 2ND QUESTION BPJS Baru Registration • A lot of the new patients do not know about the documents they must bring in order to register so that sometimes they have to go back home or go to photocopy station if there’s missing documents. This affect the registration time since sometimes they have been called but they’re still somewhere else. BPJS Lama Registration • Lack of server & ineffective queuing position Poli Penyakit • Every server has different opening time where a lot of patients have been waiting Pharmacy • There is no specific job for each employees & sometimes there is downtime sin the Doctors send the medicine receipt by server online
- 62. 63 • How many staff should be assigned to reach the objective with the lowest possible cost? SquadBPJANSWER TO THE 3RD QUESTION BPJS Baru • 4 staff BPJS Lama • 7 staff Poli Penyakit • Penyakit Dalam 8 staff, Syaraf 4 staff & jantung 4 staff Pharmacy • 2 staff
- 63. 64 • What are the new and most effective business process ideas for the hospital to reach the objective? SquadBPJANSWER TO THE 4TH QUESTION BPJS Lama • Add servers & services, & give clear way-finding instruction for patients Poli Penyakit Dalam • Open room that used to be unused, open every checking room at the same time (7.30 a.m.) & make the first line as priority seat Poli Jantung • Open every checking room at the same time (7.30 a.m.) & make 8 priority seat Poli Syaraf • Open every checking room at the same time (7.30 a.m.)
- 64. 32 • Other solutions that should be considered SquadBPJANSWER TO THE 5TH QUESTION Make a clear way- finding & signage system Make information board detailing the procedures of BPJS registration Utilizing the website for real-time waiting line information at the hospital Making a clear job description for resources to avoid idle human resources
- 67. ANALYSIS MODEL IMPROVEMENT 68 The Data After Improvement (Waiting Time) BPJS LAMA =79.23 min BPJS BARU = 40.34 min POLI PD = 68.71 min POLI SYARAF = 60.86 min POLI JANTUNG = 77.21 min FARMASI = 50.31 min The Data Before Improvement (Waiting Time) BPJS LAMA =112.4 min BPJS BARU = 47.71 min POLI PD = 98.67 min POLI SYARAF = 71.48 min POLI JANTUNG = 155.59 min FARMASI = 196.42min
- 70. CONCLUSION Concluding our project research 71 • The process of finding solutions through making models involves making a conceptual model based on the real world and then a computer model based on the conceptual model. • The BPJS system in RSUD Pasar Minggu consists of BPJS Lama registration, BPJS Baru registration, polyclinic, and pharmacy. • The bottleneck of the system relative to the number of entries is Poli Jantung. • We improved the system by adding servers and introducing a punctuality policy for doctors and employees.
- 71. THANK YOU - Aisha Adilla (1406606152) - Givanny Permata Sari (1406606070) - Hanny Riana (1406606341) - Latifa Ayu Lestari (1406606354) - Salma Nabila Hadi (1406553133) - Sarah Marsha Davinna (1406553285) SquadBPJ


