Location via proxy:   [ UP ]  
[Report a bug]   [Manage cookies]                
SlideShare a Scribd company logo
PROJECT

www.jaconline.com.au

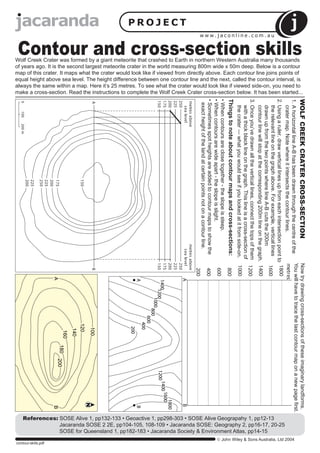
Wolf Creek Crater was formed by a giant meteorite that crashed to Earth in northern Western Australia many thousands
of years ago. It is the second largest meteorite crater in the world measuring 800m wide x 50m deep. Below is a contour
map of this crater. It maps what the crater would look like if viewed from directly above. Each contour line joins points of
equal height above sea level. The height difference between one contour line and the next, called the contour interval, is
always the same within a map. Here it’s 25 metres. To see what the crater would look like if viewed side-on, you need to
make a cross-section. Read the instructions to complete the Wolf Creek Crater cross-section below. It has been started...

Contour and cross-section skills

WOLF CREEK CRATER CROSS-SECTION

���
���
���
���
���
���

Now try drawing cross-sections of these imaginary landforms.

���
���
���
���
������ �����
� �� �����
���
���
���
���
���

�

�

����
����
����
�

�

���
���
���

���

���

���

���

���

���

���

����

�

N

�

����
���� ����

�

You will have to trace the last contour map on a new page first.
1. A horizontal line A-B has been drawn through the centre of the
������
crater map. Note where it intersects the contour lines.
2. Using a ruler, draw vertical lines up from each intersection point to ����
the relevant line on the graph above. For example, vertical lines
����
drawn up from the two points where line A-B cuts the 200m
contour line will stop at the corresponding 200m line on the graph. ����
3. Once you’ve drawn all the vertical lines, connect the tops of them ����
with a thick black line on the graph. This line is a cross-section of
the crater — what you would see if you looked at it from side-on. ����

Things to note about contour maps and cross-sections:

��� �

���

• When contours are close together - the slope is steep.
• When contours are wide apart - the slope is slight.
• Sometimes spot heights are added to contour maps to show the
exact height of the land at certain points not on a contour line.

���

 John Wiley & Sons Australia, Ltd 2004

contour-skills.pdf

������ �����
� �� �����
���
���
���
���
���

�

�

References: SOSE Alive 1, pp132-133 • Geoactive 1, pp298-303 • SOSE Alive Geograpahy 1, pp12-13
Jacaranda SOSE 2 2E, pp104-105, 108-109 • Jacaranda SOSE: Geography 2, pp16-17, 20-25
SOSE for Queensland 1, pp182-183 • Jacaranda Society & Environment Atlas, pp14-15
More Related Content

Contour skills

  • 1. PROJECT www.jaconline.com.au Wolf Creek Crater was formed by a giant meteorite that crashed to Earth in northern Western Australia many thousands of years ago. It is the second largest meteorite crater in the world measuring 800m wide x 50m deep. Below is a contour map of this crater. It maps what the crater would look like if viewed from directly above. Each contour line joins points of equal height above sea level. The height difference between one contour line and the next, called the contour interval, is always the same within a map. Here it’s 25 metres. To see what the crater would look like if viewed side-on, you need to make a cross-section. Read the instructions to complete the Wolf Creek Crater cross-section below. It has been started... Contour and cross-section skills WOLF CREEK CRATER CROSS-SECTION ��� ��� ��� ��� ��� ��� Now try drawing cross-sections of these imaginary landforms. ��� ��� ��� ��� ������ ����� � �� ����� ��� ��� ��� ��� ��� � � ���� ���� ���� � � ��� ��� ��� ��� ��� ��� ��� ��� ��� ��� ���� � N � ���� ���� ���� � You will have to trace the last contour map on a new page first. 1. A horizontal line A-B has been drawn through the centre of the ������ crater map. Note where it intersects the contour lines. 2. Using a ruler, draw vertical lines up from each intersection point to ���� the relevant line on the graph above. For example, vertical lines ���� drawn up from the two points where line A-B cuts the 200m contour line will stop at the corresponding 200m line on the graph. ���� 3. Once you’ve drawn all the vertical lines, connect the tops of them ���� with a thick black line on the graph. This line is a cross-section of the crater — what you would see if you looked at it from side-on. ���� Things to note about contour maps and cross-sections: ��� � ��� • When contours are close together - the slope is steep. • When contours are wide apart - the slope is slight. • Sometimes spot heights are added to contour maps to show the exact height of the land at certain points not on a contour line. ���  John Wiley & Sons Australia, Ltd 2004 contour-skills.pdf ������ ����� � �� ����� ��� ��� ��� ��� ��� � � References: SOSE Alive 1, pp132-133 • Geoactive 1, pp298-303 • SOSE Alive Geograpahy 1, pp12-13 Jacaranda SOSE 2 2E, pp104-105, 108-109 • Jacaranda SOSE: Geography 2, pp16-17, 20-25 SOSE for Queensland 1, pp182-183 • Jacaranda Society & Environment Atlas, pp14-15