Coulton Sess6 101309
- 1. Refining Reservoir Capacity Tables for Improved Water Management2009 California Water ConferenceSociety of Military Engineers Sacramento PostRadisson Hotel, Sacramento CAOctober 27, 2009Kevin Coulton, P.E.,CFMAECOM
- 2. Agenda
- 3. IntroductionAn investigation into the accuracy of the reservoir capacity table was made at Hungry Horse Reservoir in Montana. Comparisons of existing and refined active storage volumes were made and considerations for power planning were assessed. Based on the findings from this investigation, recommendations for related capacity table investigations at other reservoirs are made.
- 4. BackgroundHungry Horse Reservoir descriptionBPA reservoir bank storage studyCapacity table evaluation
- 6. Hungry Horse ReservoirConstructed from April 1948 to July 1953, filled on July 1954.Concrete arch dam 171.9-meters (564-feet) high and 644.7-meters (2,115-foot) crest length.Approximate 9,637-hectares (23,813-acre) surface area and 56.4-kilometer (35-mile) length at full pool.
- 7. Hungry Horse ReservoirHungry Horse Reservoir has the highest pool elevation reservoir in the entire Columbia Basin system at 1,085-meters (3,560-feet) NGVD.The reservoir has an active storage volume of 367,000-hectare-meters (2.98 million acre-feet) representing about 87% of the total reservoir volume.Most importantly, this active storage is about 10% of the total storage available in the entire Columbia River system. The reservoir has a 1.18-year storage ratio (usable storage to average annual runoff); i.e., drawdown can extend through more than one low water period.
- 9. BPA Reservoir Bank Storage StudySince thefilling of the reservoir in 1954, imbalances between reservoir inflows and outflows were observed and were believed to be associated with bank storage.
- 10. Bank storage is the volume of water stored in the geologic materials of the reservoir banks (the diagram below shows bank storage in a floodplain setting).BPA Reservoir Bank Storage StudyIn the early 1990s, the Bonneville Power Administration (BPA) believed that the volume of water temporarily stored in the banks of Hungry Horse Reservoir should be incorporated in the capacity table of the reservoir and recognized in power planning; a work plan was prepared in 1991 to study this issue.Bank storage can be inferred as the residual error in the water balance equation:Improving the accuracy of the capacity table will reduce error in the change-in-storage water balance parameter which, in turn, can increase the ability to better define bank storage.An initial phase of the study included an evaluation of the capacity table.BANK STORAGE = OUTFLOW - INFLOW +/- CHANGE IN RESERVOIR STORAGE
- 11. BPA Reservoir Bank Storage StudyStudy objective - Evaluate the adequacy and consistency of data for future use in water balance studies to estimate reservoir bank storage. Study tasks included:Geologic and hydrologic data collectionAgency visits and field reconnaissanceGeologic mappingCapacity table evaluation
- 12. Methodology – Capacity Table EvaluationDocument the existing capacity table.Develop a refined capacity table.Compare the old and new datasets and estimate the change in reservoir volume.Identify reasons for the change in volume.Provide recommendations for refining capacity table data at other reservoirs.
- 13. The Existing Capacity TableDated August 1969, but derived originally from 1954 topographic mapping by the Bureau of Reclamation.Mapping of the upper reaches of the reservoir performed by field sketching.
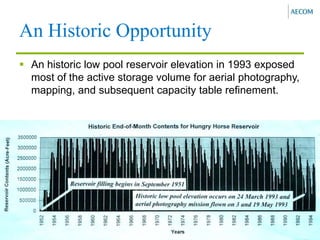
- 14. An Historic OpportunityAn historic low pool reservoir elevation in 1993 exposed most of the active storage volume for aerial photography, mapping, and subsequent capacity table refinement.
- 15. Reservoir MappingMapping ground control was rapidly established using GPS and a helicopter to transport personnel and equipment.
- 16. Estimate Change in Reservoir VolumeA Digital Terrain Model (DTM) was prepared from a photogrammetric model and used to compare new reservoir volumes to old volumes.
- 17. Capacity Table ComparisonsThe new (1993) data were compared to data currently in use (1969).Volumes were compared at 3.05-meter (10-foot) elevation increments.Incremental volumes were consistently larger and the total mapped storage was 0.7% larger than assumed.
- 18. Reasons for Reservoir Volume ChangeMapping and analysis methodsOriginal mapping done in 1954 using now outdated photogrammetric methods and sketch mapping.Vegetation obscured true bare earth elevations.Field survey and remote sensing techniques have dramatically improved in accuracy since then.Erosion of reservoir banksBoat wakesWind wavesIce Draft-refill action and freeze-thaw actionSteep banks allows eroded sediment to deposit in dead storage zone
- 19. Erosion of Reservoir BanksEvidence of approximately 1-meter soil loss from long-term reservoir bank erosion; eroded soils are discharged into the dead storage portion of the reservoir.
- 20. Boat Wake and Wind Wave ErosionThe reservoir is a popular attraction for boaters. The cumulative effect of boat wakes over time contributes to bank erosion within the active storage zone. Wind wave erosion action can be significant along steep sloped reservoir banks where limited wave energy dissipation exists in deep water.
- 21. Mechanical Erosion by IceLarge evacuations of water occur from the reservoir between December and March. Ice formed in the winter is drawn down with the water and erodes exposed reservoir banks.
- 22. ResultsTopographic and geologic mapping Capacity table comparisonsWater management considerationsPower planning considerations
- 23. Topographic and Geologic MappingThe mapping effort resulted in a 1:24,000 scale and 3-meter (10-foot) contour topographic map and DTM of the 56.3-kilometer (35-mile) long reservoir.The surface areas of geologic map units comprising the reservoir banks were estimated using the DTM.
- 24. Water Management ConsiderationsA more accurate capacity table will provide:More accurate estimates of reservoir inflow; inflow is computed by algebraically adding the daily change in reservoir storage to the gauged daily discharge from the dam.More accurate estimates of firm power production capability.
- 25. Power Planning ConsiderationsPower planning is coordinated as though all utilities in the region operate as a single utility.An annual plan is developed to estimate how much power can be available on a guaranteed, or firm, basis each year.Firm power is established assuming the present system experiences the worst sequence of streamflows on record—termed the critical period.Each 0.03 cubic meter per second (one cubic foot per second) of water released from the reservoir generates approximately 25 kilowatts (KW) at site.
- 26. Power Planning ConsiderationsThe average annual flow of 99.1-cms (3,500-cfs) at Hungry Horse Dam results in an average annual power production of approximately 98 mega-watts (MW) at the reservoir and an average annual power contribution of 593 MW for the 20 downstream federal and non-federal projects in the Coordinated System.The 0.7-percent larger useable storage volume was estimated by BPA to result in cumulative power benefits of about 1.4 MW, worth about $1 million (1993) over the 42.5-month critical period.
- 28. ConclusionsReservoir operations in the U.S. are facing increasing water demands making every increment of water stored in reservoirs more valuable. There is value in re-evaluating conventional tools to manage reservoir water resources, including the reservoir capacity table.Many U.S. reservoirs were constructed in the early part of the 20th century when aerial photography and even sketch maps were used to derive topographic data to construct capacity tables and these relationships may have significant errors in them due to the accuracy of the methods used at the time and years of erosion or deposition within the active storage zone of the reservoir.
- 29. Conclusions (continued) An investigation of the Hungry Horse Reservoir capacity table in Montana illustrates methods to refine capacity table volume estimates. These activities could potentially be part of a drought contingency plan where reservoirs reaching historic low pool elevations would be flown to collect newer LIDAR topographic data that would in turn be used to update and refine existing capacity tables.
- 30. RecommendationsThe findings from this investigation at Hungry Horse Reservoir have led to recommendations for reviewing reservoir capacity table accuracy at other reservoirs and improving management tools and procedures where feasible. With regard to a review of a reservoir capacity table, efforts may be taken to:Prioritize a review of large active storage reservoir projects (where a small capacity error would result in a relatively significant volume error);Prioritize a review of older reservoir projects (where out-dated mapping techniques used to develop the capacity table may likely be improved on and long-term reservoir bank erosion may be significant);
- 31. Recommendations (continued)Compare dates of the critical period to the date of reservoir construction (critical periods derived from historic streamflows occurring after reservoir construction may imply historic critical period reservoir inflows were estimated using reservoir change in storage, derived from an erroneous capacity table);Perform sensitivity tests with reservoir operation computer simulations (by varying reservoir active storage volume changes can be evaluated for their effect on system power production and water management);Develop a contingency plan for acquiring reservoir aerial photography should an abnormally low pool elevation be experienced in the future.
- 32. AcknowledgementsThis work was funded by the Bonneville Power Administration in 1993 and managed by the BPA Reservoir Operations Section in Vancouver WA.The study was managed by the author while with a previous employer.
- 33. Questions?


