Lots of cows on the road. The way from postdoc to docent in East Africa and India
- 1. Lots of cows on the road. The way from postdoc to docent in East Africa and India Johanna Lindahl Online seminar at the Swedish University of Agricultural Sciences Uppsala, Sweden 14 May 2020
- 2. Today’s talk 1. What is ILRI? 2. Why an international livestock research institute? 3. Who am I and what do I want to do? 4. Examples of projects I am working on
- 3. A history of international livestock research • International Laboratory for Research on Animal Diseases • International Livestock Centre for Africa • Merged in 1994 - ILRI
- 5. International Livestock Research Institute CGIAR 2 Departments: Integrated sciences Biosciences • Animal & human health Nairobi Main campus Nairobi Second campus Addis Ababa
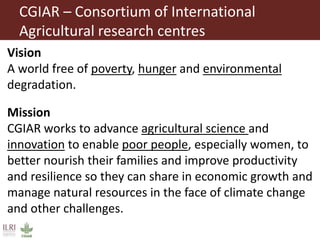
- 6. CGIAR – Consortium of International Agricultural research centres Vision A world free of poverty, hunger and environmental degradation. Mission CGIAR works to advance agricultural science and innovation to enable poor people, especially women, to better nourish their families and improve productivity and resilience so they can share in economic growth and manage natural resources in the face of climate change and other challenges.
- 7. CGIAR – from 4 + 8 to 15 + 64 www.cgiar.org 1971 4 centres 18 countries 2009 15 centers 25 developing countries 39 developed countries
- 8. CGIAR – Global coverage 15 centers
- 9. CGIAR Center Headquarter Africa Rice Centre Cotonou, Benin Bioversity International Rome, Italy Center for International Forestry Research (CIFOR) Bogor, Indonesia International Center for Tropical Agriculture (CIAT) Cali, Colombia International Center for Agricultural Research in the Dry Areas (ICARDA) Beirut, Lebanon International Crops Research Institute for the Semi-Arid Tropics (ICRISAT) Hyderabad, India International Food Policy Research Institute (IFPRI) Washington, USA International Institute of Tropical Agriculture (IITA) Ibadan, Nigeria International Livestock Research Institute (ILRI) Nairobi, Kenya International Maize and Wheat Improvement Center (CIMMYT) El Batán, Mexico International Potato Center (CIP) Lima, Peru International Rice Research Institute (IRRI) Los Baños, Philippines International Water Management Institute (IWMI) Battaramulla, Sri Lanka World Agroforestry Centre (ICRAF) Nairobi, Kenya
- 10. CRPs - CGIAR Research Programs
- 11. CGIAR Research Programs – 12 CRPs Second phase, 2017-2022 Agri-Food Systems CRPs 1. Dryland Cereals and Legumes , DCL 2. Fish 3. Forests, Trees and Agroforestry, FTA 4. Livestock 5. Maize 6. Rice 7. Roots, Tubers and Bananas, RTB 8. Wheat Agri-Food Systems WHEAT Other CRPS 9. Agriculture for Nutrition and Health, A4NH 10. Climate Change, Agriculture, and Food Security, CCAFS 11. Policies, Institutions, & Markets, PIM 12. Water, Land and Ecosystems, WLE
- 12. Funding - 2010 CGIAR Fund - Bilateral and other
- 13. CGIAR – $ 1 billion per year
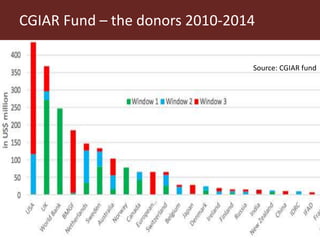
- 14. CGIAR Fund – the donors 2010-2014 Source: CGIAR fund
- 15. CGIAR Fund – the donors 2010-2014 Source: CGIAR fund
- 16. CGIAR Fund– support from Sweden - 50,000 100,000 150,000 200,000 250,000 300,000 2009 2010 2011 2012 2013 2014 2015 2016 Sweden support to CGIAR centrally (‘000 SEK) Win 1 Win 2 - CRPs Win 3 - Centres (Source: Philip Chiverton, Sida).
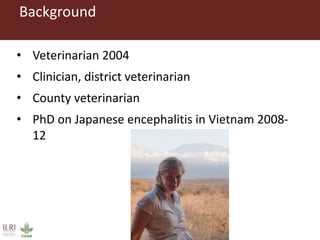
- 17. Background • Veterinarian 2004 • Clinician, district veterinarian • County veterinarian • PhD on Japanese encephalitis in Vietnam 2008- 12
- 18. Then what… • Post-doc at ILRI 2013-15, joint appointment with SLU • Scientist, senior scientist… • Docent in Infection Biology at Uppsala University
- 19. And now? • Joint appointment: • ILRI department of integrated sciences- Food Safety and Zoonoses • SLU department of clinical sciences- Reproduction • Uppsala University- Zoonosis Science Centre • Pet topics • Vector-borne diseases • Wildlife-livestock interactions • Disease emergence
- 20. OneHealth - One World
- 21. 7 billion reasons for more agricultural research More and more people to feed More and more are not producing food The rest need to produce more 2 billion hidden hunger One billion hungry 1.7 billion overweight/obese
- 22. 7 billion people… • 37 billion livestock 31 billion in developing countries 1 billion poor people depend on livestock 600 million in South Asia 300 million in Sub-Saharan Africa 25% urban
- 23. Bridging the gaps between demand and supply – global level • 60% more food than is produced now will be needed • 75% of this must come from producing more food from the same amount of land • The higher production must be achieved while reducing poverty and addressing environmental, social and health concerns • This greater production will have to be achieved with temperatures that may be 2−4 degrees warmer than today’s
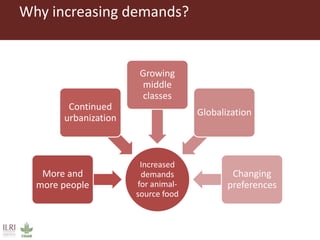
- 24. Why increasing demands? Increased demands for animal- source food More and more people Continued urbanization Growing middle classes Globalization Changing preferences
- 25. The livestock revolution • 1970-mid 1990s • Demand-driven, unlike the green revolution 0 100 200 300 400 500 600 700 800 900 1000 1100 1200 1963 1973 1983 1993 2003 2025 2050 Eggs Meat -total Fish Vegetables Milk (whole) Fruits Pulses Figure 2: Increase in per capita consumption of perishables and pulses in developing countries with 1963 as index year (FAO, 2009).
- 26. Gains in meat consumption in developing countries are outpacing those of developed countries 0 50 100 150 200 250 300 1980 1990 2002 2015 2030 Millionmetrictonnes developing developed FAO 2006
- 27. Change in global and regional demand for food: Livestock and other commodities -50 0 50 100 150 200 250 300 350 developed developing SSA SA %change2005/07to2050 cereals root/tuber meat dairy Modified from Alexandratos and Bruinsma 2012
- 28. FAO statistics 2012 0 1,000,000,000 2,000,000,000 0 100,000,000 200,000,000 Production 1000 USD Production MT
- 29. Steinfeld et al. 2006 Big productivity gaps largely due to poor animal health, inadequate feed and low genetic potential Some developing country regions have gaps of up to 430% in milk
- 30. Example: Greenhouse gases Herrero et al. 2013 Greenhouse gases per kg of animal protein produced
- 31. Infectious diseases • Neglected • Mainly affecting poor communities • Chronic morbidity Source: WHO
- 32. Endemic diseases (neglected zoonoses) Source: WHO
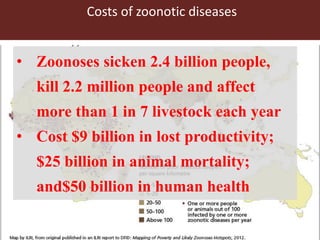
- 33. • Zoonoses sicken 2.4 billion people, kill 2.2 million people and affect more than 1 in 7 livestock each year • Cost $9 billion in lost productivity; $25 billion in animal mortality; and$50 billion in human health Costs of zoonotic diseases
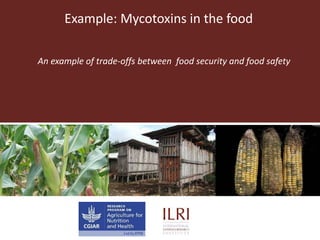
- 35. Example: Mycotoxins in the food An example of trade-offs between food security and food safety
- 36. Never heard about aflatoxins? • Acute outbreaks can claim 100s of lives (Kenya outbreak 2004-2005 150 known fatal cases) • 4.5 billion people chronically exposed (estimate by US CDC) •Cancer •Immunosuppression •Stunting
- 37. What are aflatoxins? • Aflatoxin “discovered” as the cause of Turkey X disease, 1960s • Toxin produced by Aspergillus spp., mainly Aspergillus flavus and Aspergillus parasiticus • Aspergillus flavus toxin http://www.fda.gov/Food/FoodborneIllnessContam inants/CausesOfIllnessBadBugBook/ucm070664.htm
- 38. Farmer Consumer Economic flow Aflatoxin flow Human exposure Feed producer AB1 AB1 AB1-> AM1 AM1 Corn/feed produced at farm Corn/feed purchased Milk produced at farm AB1 AM1 Treatments Feed seller Farmer Veterinary services Milk retailer Agricultural services Consumer
- 39. Dairy products and levels of aflatoxin 0 200400600800 1,000ppt Lala PasteurizedMilk BoiledMilk PasteurizedMilk Raw Milk UHTYoghurt Pasteurized Lala Boiled milk Fresh milk Raw milk UHT milk Yoghurt Pilot study show association with stunting!
- 42. How is ILRI working on this problem? • Exposure of aflatoxin • Levels of aflatoxin • Consumption of contaminated products • Who are the consumers? • Children • Pregnant and nursing mothers • The first 1000 days • Where is the problem? • Risk mapping
- 43. How is ILRI working on this problem? • Can we prevent aflatoxins? • Dryers, new technologies etc. • What can we do with contaminated products? • Biodegradation • Binders • Policy and regulations • What will happen in the future? • Predictive forecasting • Climate change
- 44. Food security Food safety What can we do with the results? Do no harm!
- 45. Example- Milk production in India Is there always a trade-off between food safety and food security?
- 46. Milk consumption in India • Milk consumption 46 kg per capita in 1983; 62 kg per capita in 1997; and, 106 kg in 2011-12 • Estimated total annual consumption of 60 million megatons • India consumed 13% of the milk in the world
- 47. Risks and benefits associated with dairy Pathogens from the cow and from the milk • Mycobacterium bovis • Brucella spp. • Bacillus anthracis • Salmonella • EHEC • Streptococcus spp. • Staphylococcus aureus • Clostridium spp. • Listeria spp.
- 48. The importance of dairy production: Assam • One of the poorest states • Over 30 million people, 27% rural • Agriculture accounts for ¼ of the state’s domestic product • 8.5 million cattle, >90% indigenous • 97% marketed in the informal traditional market • Most initiatives focus on the organized sector 48
- 49. Adulteration: a problem? 1. Producers in 2009: 0-66% water added 2. Traders in 2009: 2-55% water added 3. Producers in 2012: between 0-28 % water added 4. Traders in 2012: 0-31 % water added Adulteration occurs at every step! Consumers can not tell the difference! No clear association with bacterial count
- 50. Can diseases be transmitted from dung? 50 Believe diseases can be transmitted from dung Producers 2009 2.7% (11/404) 2012 37.2% (60/161)*** Trained (2012) 69.8% (37/53)*** Untrained (2012) 21.3% (23/108) Traders 2009 1.1% (2/175) 2012 47.1% (106/225)*** Trained (2012) 63.9% (78/122)*** Untrained (2012) 27.2% (28/103) Comparison between 2009 and 2012 survey Comparison between trained and untrained 2012 Comparison between 2009 and untrained 2012
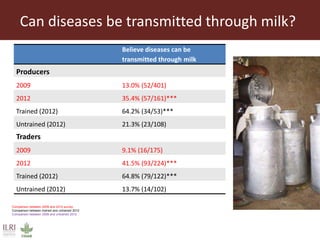
- 51. Can diseases be transmitted through milk? 51 Believe diseases can be transmitted through milk Producers 2009 13.0% (52/401) 2012 35.4% (57/161)*** Trained (2012) 64.2% (34/53)*** Untrained (2012) 21.3% (23/108) Traders 2009 9.1% (16/175) 2012 41.5% (93/224)*** Trained (2012) 64.8% (79/122)*** Untrained (2012) 13.7% (14/102) Comparison between 2009 and 2012 survey Comparison between trained and untrained 2012 Comparison between 2009 and untrained 2012
- 52. Which diseases can be transmitted? Tuberculosis Food poisoning/ gastrointestinal disease General disease symptoms (fever, cough, cold) Worms Producers 2009 3.5% (14/405) 18.3% (74/405) 0.3% (1/405) 4.7% (19/405) 2012 8.7% (14/161)** 36.0% (58/161)*** 11.2% (18/161)*** 9.3% (15/161)* Trained (2012) 18.9% (10/53)*** 64,2% (34/53) *** 20.8% (11/53)** 9.4% (5/53) Untrained (2012) 3.7% (4/108) 22.2% (24/108) 6.5% (7/108)*** 9.3% (10/108) Traders 2009 4.0% (7/175) 9.7% (17/175) 0% (0/175) 2.9% (5/175) 2012 13.7% (31/226)*** 42.9% (97/226)*** 11.5% (26/226)*** 4.0% (9/226) Trained (2012) 23.8% (29/122)*** 61.5% (75/122)*** 20.5% (25/122)*** 6.6% (8/122)* Untrained (2012) 1.9% (2/104) 21.2% (22/104)** 1.0% (1/104) 1.0% (1/104) 52 Comparison between 2009 and 2012 survey Comparison between trained and untrained 2012 Comparison between 2009 and untrained 2012
- 53. What was the food security effect? • Farmers reported healthier animals, less mastitis, better production Average milk production in litres per cow and day 2 years ago/before ILRI training Average milk production in litres per cow and day now Trained farmers 7.0 (range 2.5-10) 7.8 (range 3-15) Untrained farmers 7.3 (range 2.5-14) 6.8 (range 2.5-14)
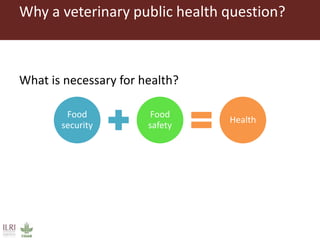
- 54. Why a veterinary public health question? What is necessary for health? Food security Food safety Health
- 55. Project 2: Peri-urban milk production • Can we affect the incidence of bovine tuberculosis? • Can we affect the prevalence of antibiotic residues? • Evaluate the risks • Identify risk practices • Pilot interventions
- 56. Project 3: Animal health in Bihar • Bihar is one of the poorest and least developed states • Common farm size: 1-3 dairy cows or buffaloes • 3-5 litres of milk • Little is known about the limitations to the dairy production
- 57. Scoping study about the animal health problems • Collecting morbidity and mortality data • Including mastitis and antibiotic resistance • Production and cost estimates • Serology for selected diseases • Brucella, Leptospira, Q fever, haemorrhagic septicemia • Special focus on brucellosis • Evaluation of rapid tests • Molecular testing
- 58. Example: Dynamic drivers of disease in Africa One action- different outcomes
- 59. Case study: Kenya • Rift valley fever/mosquitoes • Land use changes – Protected area vs. irrigated area – Pastoralist areas
- 60. Case study: Kenya • Making changes in a highly diverse landscape • Increased number of scavengers • Increased numbers of mosquitoes
- 61. Case study: Kenya • Participatory rural appraisals indicated a concern about rodents
- 62. Case study: Kenya • What to study: – Can we trust hospital data? – Screen all febrile patients – Too many differentials: malaria, RVF, dengue, YF, Brucella, Leptospira, Chikungunya, CCHF
- 63. Case study: Kenya • Who to study: – Humans and livestock – Mosquitoes – Rodents – Bats – Ticks
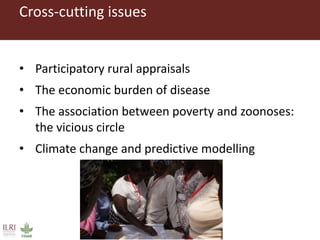
- 64. Cross-cutting issues • Participatory rural appraisals • The economic burden of disease • The association between poverty and zoonoses: the vicious circle • Climate change and predictive modelling
- 65. Irrigation: preliminary results 0.00 0.10 0.20 0.30 0.40 RVF WNV Dengue Irrigateed area Non-irrigated area Disease Seroprevalence Irrigated area
- 66. Intervention points 0 0.1 0.2 0.3 0.4 0.5 0.6 Proportion Communities’ perceptions on diseases that manifest similar signs as malaria – limited knowledge on arboviruses
- 67. More material than we can manage to analyze… • Multiple diseases • Still mosquitoes and ticks to identify and screen for virus • Rodents and bats? • The association between poverty and zoonoses: the vicious circle • Climate change and predictive modelling
- 68. The future • Metropolitan mosquitoes: Understanding urban livestock keeping and vector-borne disease in growing tropical cities – the potential of sustainable control methods and the risks for emergence to Sweden. Thang Nguyen-Tien Long Pham- Thanh
- 69. Work packages 3. Evaluate the epidemiology of flaviviruses in the two urban areas and establish multiplex testing methods for screening of arboviral diseases in different matrices, but with a focus on vectors. Screening started, indicating that above 70% of pigs are seropositive for flaviviruses, and that three serotypes of dengue virus are co- circulating in humans. 4. Review previous interventions in urban environments and identify best-bet, low cost interventions which are piloted and evaluated. Piloted in vector season 2019
- 70. Antimicrobial resistance and antibiotic residues in livestock and livestock products
- 71. Antimicrobial resistance and antibiotic residues in livestock and livestock products Milk from dairy cattle in 2016 1. Methicillin resistant Staphylococci was 4.75% in Haryana, but not detected in Assam 2. ESBL/MBL/AmpC producing Gram-negative bacteria were found in 12.69% in Haryana and 10.34% in Assam 3. First time discovery of MecC positive staphylococci from cow and buffalo milk sample in Bhiwani District, Haryana Tushar Kumar Dey Garima Sharma
- 72. Come visit us
- 73. Come visit us
- 74. This presentation is licensed for use under the Creative Commons Attribution 4.0 International Licence. better lives through livestock ilri.org


