Location via proxy:   [ UP ]  
[Report a bug]   [Manage cookies]                
SlideShare a Scribd company logo
CP Physics GOOD MORNING! PLEASE… TAKE OUT YOUR HOMEWORK & PUT IT TO THE SIDE OF YOUR DESK, TO BE CHECKED ANSWER THE WARM-UP QUESTION: Using the graph provided, describe  the object’s motion for the following  time intervals: 0-4 seconds 4-6 seconds 6-10 seconds 10-12 seconds
Housekeeping Word Wall Grades See grades posted at front of room by end of class Highlight any errors & show me your work
Homework Solutions Practice Problems 2B 1. Time = 2.2 seconds 2. Time = 2 seconds 3. Time = 27 seconds 4. acceleration = -0.0035 m/s2 5. a) change in velocity = 1.41 m/s b) final velocity = 3.11 m/s
Due Next Class Graphical analysis worksheet Due Monday, 9/30:  Constant velocity lab data analysis and discussion questions Both the table and graph should be produced on a separate sheet of paper Use a ruler Read directions completely! Make sure to always include units Explain answers thoroughly
 
Let ’s Review VELOCITY is the SLOPE of a distance, position, or displacement vs. time graph.
Let ’s Review What is the slope doing? CHANGING, INCREASING What is the velocity doing? CHANGING, INCREASING
Now for Velocity vs. Time Graphs In a velocity vs. time graph, acceleration is the slope
Velocity vs. Time Graphs Describe the acceleration during interval A. The acceleration or SLOPE is constant and positive. Describe the acceleration during interval B. The acceleration or SLOPE is ZERO. Describe the acceleration  during interval C. The acceleration or SLOPE is constant and negative.
NEW MODEL = AREA LET’S REVIEW: We know that we can calculate the velocity of an object if given the displacement vs. time graph (find slope) We can also calculate the total displacement of an object if given the velocity vs. time graph This is done by  finding the area under the curve
The Area Model How  FAR  did this object  travel during interval A? How  FAR  did this object  travel during interval B? How  FAR  did this object travel during interval c?
The Area Model The same thing can be done  to find velocity, if given an acceleration vs. time graph Find the area under the curve.
The Area Model  v What is the change in Velocity during the t=2 to t=4 interval? You can also calculate the change in velocity by calculating the area under the curve of an acceleration vs. time graph.
In summary t (s) t (s) t (s) x (m) v (m/s) a (m/s/s) slope = v slope = a area = x area = v Graph Slope Area x vs. t Velocity N/A v vs. t Acceleration Displacement a vs. t N/A Velocity Slope Graph Area x  vs. t v  vs. t a  vs. t
Comparing and Sketching graphs One of the more difficult applications of graphs in physics is when given a certain type of graph and asked to draw a different type of graph t (s) x (m) slope = v t (s) v (m/s) List 2 adjectives to describe the SLOPE or VELOCITY The slope is CONSTANT The slope is POSITIVE How could you translate what the SLOPE is doing on the graph ABOVE to the Y axis on the graph to the right?
Graphical Analysis We can produce velocity vs. time graphs, and acceleration vs. time graphs based on information from a distance vs. time graph! Stationary Object Distance vs. Time Velocity vs. Time Acceleration vs. Time Object with Constant Speed Distance vs. Time Velocity vs. Time Acceleration vs. Time
Graphical Analysis We can produce velocity vs. time graphs, and acceleration vs. time graphs based on info from a distance vs. time graph! Distance vs. Time Velocity vs. Time Acceleration vs. Time
Example t (s) x (m) t (s) v (m/s) 1 st  line 2 nd   line 3 rd   line The slope is constant The slope is constant The slope is  “+” The slope is  “-” The slope is  “0” Sketching a velocity vs. time graph given a distance vs. time graph
Coming up: Building a catapult! Will be done in groups of 3 Graded based on: Constructability Accuracy: hitting a target 10 meters away Due sometime at end of October: Date TBA A kinematic story: Write a story and create a d vs. t, v vs. t, and a vs. t graph to accompany your story Must have at least 5 trip segments within story Due next Tuesday, 10/4
Kinematic #1
Kinematic #1 Example:   A boat moves slowly out of a marina (so as to not leave a wake) with a speed of 1.50 m/s. As soon as it passes the breakwater, leaving the marina, it throttles up and accelerates at 2.40 m/s/s . a) How fast is the boat moving after accelerating for 5 seconds? 13. 5 m/s What do I know? What do I want? v o = 1.50 m/s v = ? a = 2.40 m/s/s t = 5 s
Kinematic #2 b) How  far  did the boat travel during that time? 37.5 m
Does all this make sense? 1.5 m/s 13.5 m/s Total displacement = 7.50 + 30 = 37.5 m = Total AREA under the line.
Kinematic #3 Example:   You are driving through town at 12 m/s when suddenly a ball rolls out in front of your car. You apply the brakes and begin decelerating at  3.5 m/s/s. How far do you travel before coming to a complete stop? 20.57 m What do I know? What do I want? v o = 12 m/s x = ? a = -3.5 m/s/s V = 0 m/s
Common Problems Students Have I don ’t know which equation to choose!!! Equation Missing Variable x v t

More Related Content

CP - Graphical Analysis

  • 1. CP Physics GOOD MORNING! PLEASE… TAKE OUT YOUR HOMEWORK & PUT IT TO THE SIDE OF YOUR DESK, TO BE CHECKED ANSWER THE WARM-UP QUESTION: Using the graph provided, describe the object’s motion for the following time intervals: 0-4 seconds 4-6 seconds 6-10 seconds 10-12 seconds
  • 2. Housekeeping Word Wall Grades See grades posted at front of room by end of class Highlight any errors & show me your work
  • 3. Homework Solutions Practice Problems 2B 1. Time = 2.2 seconds 2. Time = 2 seconds 3. Time = 27 seconds 4. acceleration = -0.0035 m/s2 5. a) change in velocity = 1.41 m/s b) final velocity = 3.11 m/s
  • 4. Due Next Class Graphical analysis worksheet Due Monday, 9/30: Constant velocity lab data analysis and discussion questions Both the table and graph should be produced on a separate sheet of paper Use a ruler Read directions completely! Make sure to always include units Explain answers thoroughly
  • 5.  
  • 6. Let ’s Review VELOCITY is the SLOPE of a distance, position, or displacement vs. time graph.
  • 7. Let ’s Review What is the slope doing? CHANGING, INCREASING What is the velocity doing? CHANGING, INCREASING
  • 8. Now for Velocity vs. Time Graphs In a velocity vs. time graph, acceleration is the slope
  • 9. Velocity vs. Time Graphs Describe the acceleration during interval A. The acceleration or SLOPE is constant and positive. Describe the acceleration during interval B. The acceleration or SLOPE is ZERO. Describe the acceleration during interval C. The acceleration or SLOPE is constant and negative.
  • 10. NEW MODEL = AREA LET’S REVIEW: We know that we can calculate the velocity of an object if given the displacement vs. time graph (find slope) We can also calculate the total displacement of an object if given the velocity vs. time graph This is done by finding the area under the curve
  • 11. The Area Model How FAR did this object travel during interval A? How FAR did this object travel during interval B? How FAR did this object travel during interval c?
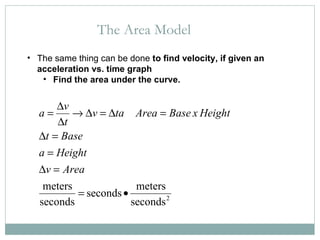
  • 12. The Area Model The same thing can be done to find velocity, if given an acceleration vs. time graph Find the area under the curve.
  • 13. The Area Model  v What is the change in Velocity during the t=2 to t=4 interval? You can also calculate the change in velocity by calculating the area under the curve of an acceleration vs. time graph.
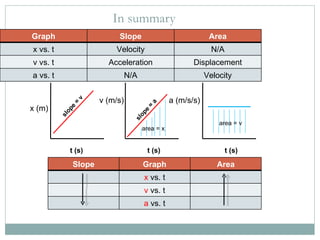
  • 14. In summary t (s) t (s) t (s) x (m) v (m/s) a (m/s/s) slope = v slope = a area = x area = v Graph Slope Area x vs. t Velocity N/A v vs. t Acceleration Displacement a vs. t N/A Velocity Slope Graph Area x vs. t v vs. t a vs. t
  • 15. Comparing and Sketching graphs One of the more difficult applications of graphs in physics is when given a certain type of graph and asked to draw a different type of graph t (s) x (m) slope = v t (s) v (m/s) List 2 adjectives to describe the SLOPE or VELOCITY The slope is CONSTANT The slope is POSITIVE How could you translate what the SLOPE is doing on the graph ABOVE to the Y axis on the graph to the right?
  • 16. Graphical Analysis We can produce velocity vs. time graphs, and acceleration vs. time graphs based on information from a distance vs. time graph! Stationary Object Distance vs. Time Velocity vs. Time Acceleration vs. Time Object with Constant Speed Distance vs. Time Velocity vs. Time Acceleration vs. Time
  • 17. Graphical Analysis We can produce velocity vs. time graphs, and acceleration vs. time graphs based on info from a distance vs. time graph! Distance vs. Time Velocity vs. Time Acceleration vs. Time
  • 18. Example t (s) x (m) t (s) v (m/s) 1 st line 2 nd line 3 rd line The slope is constant The slope is constant The slope is “+” The slope is “-” The slope is “0” Sketching a velocity vs. time graph given a distance vs. time graph
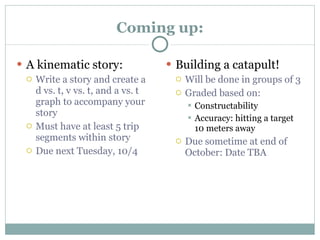
  • 19. Coming up: Building a catapult! Will be done in groups of 3 Graded based on: Constructability Accuracy: hitting a target 10 meters away Due sometime at end of October: Date TBA A kinematic story: Write a story and create a d vs. t, v vs. t, and a vs. t graph to accompany your story Must have at least 5 trip segments within story Due next Tuesday, 10/4
  • 21. Kinematic #1 Example: A boat moves slowly out of a marina (so as to not leave a wake) with a speed of 1.50 m/s. As soon as it passes the breakwater, leaving the marina, it throttles up and accelerates at 2.40 m/s/s . a) How fast is the boat moving after accelerating for 5 seconds? 13. 5 m/s What do I know? What do I want? v o = 1.50 m/s v = ? a = 2.40 m/s/s t = 5 s
  • 22. Kinematic #2 b) How far did the boat travel during that time? 37.5 m
  • 23. Does all this make sense? 1.5 m/s 13.5 m/s Total displacement = 7.50 + 30 = 37.5 m = Total AREA under the line.
  • 24. Kinematic #3 Example: You are driving through town at 12 m/s when suddenly a ball rolls out in front of your car. You apply the brakes and begin decelerating at 3.5 m/s/s. How far do you travel before coming to a complete stop? 20.57 m What do I know? What do I want? v o = 12 m/s x = ? a = -3.5 m/s/s V = 0 m/s
  • 25. Common Problems Students Have I don ’t know which equation to choose!!! Equation Missing Variable x v t