CSA Monitoring: Understanding adoption, synergies and tradeoffs at farm and household level
•
0 likes•436 views

The multilevel CSA monitoring set of standard core uptake and outcome indicators + expanded indicators linked to a rapid and reliable ICT based data collection instrument to systematically assess and monitor: - CSA Adoption/ Access to CIS - CSA effects on food security and livelihoods household level) - CSA effects on farm performance
Report
Share

CSA Monitoring: Understanding adoption, synergies and tradeoffs at farm and household level
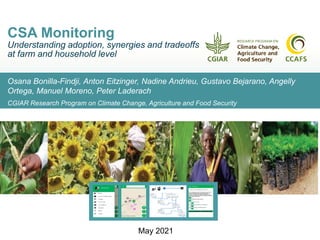
- 1. Osana Bonilla-Findji, Anton Eitzinger, Nadine Andrieu, Gustavo Bejarano, Angelly Ortega, Manuel Moreno, Peter Laderach CGIAR Research Program on Climate Change, Agriculture and Food Security CSA Monitoring Understanding adoption, synergies and tradeoffs at farm and household level May 2021
- 2. • To test through participatory methods technological and institutional CSA options for dealing with climate change (addressing the productivity, adaptation and mitigation pillars, their synergies and trade-offs) • Scaling out and up the appropriate options (addressing financial/incentives mechanisms and barriers) • Drawing lessons for policy makers from local to global levels. Components considered in a CSV AR4D Site Objectives of the CSV AR4D approach
- 3. CSA monitoring: 12 countries, 16 CSVs Farm level calculator (#): 9 CSVs CCAFS Baselines (*) ! ! ! ! ! ! ! ! ! ! ! ! ! ! ! ! ! ! ! ! ! ! ! ! ! ! ! ! ! ! ! ! ! ! GUATEMALA Olopa*# NICARAGUA El Tuma-La Dalia * COLOMBIA Cauca * (2) NIGER Fakara* BURKINA FASO Yatenga * MALI Cinzana* SENEGAL Kaffrine*# HONDURAS Santa Rita *# GHANA Lawra-Jirapa*# UGANDA Hoima * #(2) Rakai * TANZANIA Lushoto* INDIA Karnataka INDIA Haryana * Punjab INDIA Bihar * BANGLADESH Khulna * Barisal *# NEPAL Bardiya*, Nawalparasi*#, Mahotari* Gorkha* , Dang* & Rupandehi* VIETNAM My Loi LAO PDR Phonghong * & Champhone* CAMBODIA Ek Phnum PHILIPPINES Guinayangan KENYA Wote * KENYA Nyando * VIETNAM Tra Hat * VIETNAM Ma ETHIOPIA Basona-Worena Dogoyena Borana* Available data Climate-Smart Village AR4D approach It addresses the need for proven and effective CSA options in a real-life setting and facilitates co-development of scaling mechanisms towards landscapes, subnational and national levels.
- 4. Multilevel CSA monitoring Set of standard Core Uptake and Outcome indicators + Expanded indicators linked to a rapid and reliable ICT- based data collection instrument to systematically assess and monitor: CSA Adoption/ Access to CIS CSA effects on Food security and livelihoods (household level) CSA effects on farm performance 1 2 3 Who adopts/disadopts and why? Who accesses/uses CIS? How it affects incomes, food security, climate vulnerability, gender How CSA practices and Management affect performance?
- 5. Geofarmer App Productivity/food security Adaptation Mitigation CSA pillars 10 Core Outcome Indicators Expanded Indicators Integrated Climate Smart Agriculture monitoring framework ( 4 Core Gender Outcome Indicators) 7 Core Uptake Indicators
- 6. Pillar Dimension Categories PRODUCTIVITY - FOOD SECURITY Livelihood security Shocks affecting agricultural income Income & agricultural share CSA outcomes (productivity/Income) Food security Fullfilment of basic needsand food access CSA outcomes (food access and diversity) ADAPTATION - RESILIENCE Absortive Capacity Financial enablers Coping Strategies Adaptive Capacity CSA Adoption CSA effect on Gender dimensions Access to CIS Risk Mitigation actions (changes in cropping activities) Autonomous changes Climate induced changes CIS induced changes in cropping activities Innovative Capacity Radical changes in crops/animals Autonomous Climate induced innovation Knowledge and learning CSA learning Sources Non adopters interest Capacity to use CIS Constraints to the use of CIS Training CSA monitoring framework design Household level
- 7. The Core Indicators at household level 7 CORE CSA UPTAKE INDICATORS Adaptation/ Resilience [CU.1] Implementation of CSA practices [CU.2] CSA adoption drivers [CU.3] Dis-adoption of CSA practices [CU.4] CSA dis-adoption drivers [CU.5] Access to climate information services and agro-advisories [CU.6] Capacity to use climate information [CU.7] Constraining factors to the use of climate information 10 CORE CSA OUTCOME INDICATORS (perceived effects) Productivity/ Food security Adaptation/ Resilience Gender [CO.1] CSA effect on yield/production [CO.5] CSA effect on decreasing vulnerability to weather related shocks [CO.7] Decision making on CSA implementation [CO.7a] Decision making on CSA dis-adoption [CO.2] CSA effect on income [CO.6] Changes in farming activities driven by seasonal forecast [CO.8] Participation in CSA implementation [CO.3] CSA effect on improved food access [CO.9] CSA effect on labor time [CO.4] CSA effect on improved food diversity [CO.10] Decision making and control on CSA generated income
- 8. Livelihoods and Food security [E.4] Agricultural income [E.5] Main ag. Income source [E.6] Ag. Income dependency [E.7] Main food source [E.8] Fulfillment of basis food needs [E.9] HH food Insecurity Access Score (HFIAS) [E.10] HH food Insecurity Access Prevalence (HFIAP) Shocks [E.1] Frequency of climate-related events affecting agricultural incomes [E.2] Ag. Income reduction [E3] Climate-driven reduction of production Coping strategies [E.16] Coping strategies in response to climate- related events Financial enablers [E.11] Ag. saving capacity [E.12] On-farm investment capacity [E.13] Access to ag. credit [E.14] Access to ag. insurance [E.15] Access to financial incentives from buyers/ providers Risk Mitigation actions (autonomous vs climate-driven) [E.17] Changes in cropping activities [E.18] Changes in animal related activities [E.19] Innovative changes in farming activities CSA knowledge [E.20] CSA Knowledge [E.21] CSA interest by non-adopters [E.22] Access to CSA training [E.23] Access to seasonal forecast training [E.24] Access to Value Chain training Expanded Indicators at household level
- 9. 7 CORE CSA OUTCOME INDICATORS Productivity/ Food security Adaptation/ Resilience Mitigation [CP.1] Caloric ratio of the farm (%) [C.A1] Biodiversity index (%) [C.M1] Emission / Sequestration of CO2 [CP.2] Fodder ratio of the farm (%) [C.A2] Water balance (%) [CP.3] Cost/Benefit ratio (%) [C.A3] Nutrient balance (%) The Core Indicators at farm level Prospective assessment of Synergies and tradeoffs -5 -3 0 3 5 8 10 P Ad Att Survey data + Farm model => M A P
- 10. Key research questions Why? Who adopts what? 1 Perceived CSA outcomes 2 3 Participation in decision-making Control over resources CSA implementation Effect on labor time Gender Farm performance Synergies and trade-offs 4 4 Farm T1 Farm T2
- 11. Data collection Geofarmer Smart App CSA Farm Calculator Farm Calculator Animal Calculator Crop Calculator 1a. Demographic 1b. Farming system 1c. Financial services 2. Climate events 3. Climate services 4. Food Security 5. CSA practices * HH target: 2 members involved in on-farm work (opposite sex) * One is the MAIN person in charge of on-farm Agricultural work
- 12. CSA Monitoring Regional trainings * CSA Calculator sampling (farm level) * 60 *26 *30 *35 *36 *34 *42 2019 implementation in Colombia, Ethiopia, Senegal, Vietnam 2020 implementation in Guatemala, Honduras 2021 implementation in Ethiopia, Senegal, Mali, Niger, (Guatemala, Honduras)
- 13. ONLINE access to data CSA calculator data Year CSV country and site Link 2017 (pilot) Ghana- Lawra Jirapa https://geofarmer.org/csv-lawra-jirapa/archives/8744dbc9-dd77-4f7b-96cb-89e74934ab99 2018 Uganda - Hoima https://geofarmer.org/csv-hoima/archives/f704ce8e-9a01-41ff-9600-6624c9cf33f8 2018 Nepal - Bardiya https://geofarmer.org/csv-bardiya/archives/bb5f383a-7b7b-4291-95ed-81be5dec15e4 2018 Nepal - Mahottari https://geofarmer.org/csv-mahottari/archives/57dc3a1f-319c-4f54-9f87-d8494de58442 2018 Nepal - Nawalparasi https://geofarmer.org/csv-nawalparasi/archives/39034090-9e26-4775-ae78-93e5615f0c22 2018 Bangladesh - Barisal https://geofarmer.org/csv-barisal/archives/ec665e5d-7df1-4f5a-8021-cc7e3828bab1 2018 Bangladesh - Khulna https://geofarmer.org/csv-khulna/archives/c95bbdc4-2a08-42dd-b505-b4fd441e5618 2018 Colombia - Cauca https://geofarmer.org/tesac-cauca/archives/6cad129f-a20d-4012-9cf7-a43976a9a154 2018 Guatemala - Olopa https://geofarmer.org/tesac-olopa/archives/9ee525cc-ee7f-461f-8b58-3f9418acb156 2018 Honduras - Santa Rita https://geofarmer.org/tesac-santarita/archives/f5d55b8e-2846-4a92-b7a9-78392b14f606 2018 Nicaragua - Tuma la Dalia https://app.geofarmer.org/tesac-tuma-dalia/archives/92092867-2471-47a0-b45a-7bb672a54664 2019 - Master Ethiopia - Dogoyena https://app.geofarmer.org/csv-doyogena/archives/9784eeb5-0009-440a-8b5e-5f4df0181192 2019 - Master Colombia - Cauca https://geofarmer.org/tesac-cauca/archives/803b37b2-0325-4e7e-aac6-b27a526cb012 2019 - Master Senegal - Kaffrine https://app.geofarmer.org/csv-kaffrine/archives/9f94fb10-86ad-4b68-96f7-adf6afd5676c 2020 - Master Guatemala - Olopa https://geofarmer.org/tesac-olopa/archives/6c8b6798-4cdb-41d6-acd4-6a3bd6d1fec7 2020 - Master Honduras - Santa Rita https://geofarmer.org/tesac-santarita/archives/33e785c3-8174-451b-8866-c7177dabdd80 2021 - Master Ethiopia - Dogoyena https://app.geofarmer.org/csv-doyogena/archives/af01702c-f95c-499a-804c-1a1fc8c855f8 2021 - Master Ethiopia - Bazona https://app.geofarmer.org/basona-ethiopia/archives/352a03c0-82f5-4b01-a089-c6b542df41d5 2021 - Master Senegal - Kaffrine https://app.geofarmer.org/csv-kaffrine/archives/53f9eb3a-d450-4427-b8f5-1770ac20f0a1 2021 - Master Niger- Fakara https://app.geofarmer.org/fakara-niger/archives/cf6db3bd-5f7c-473f-97e1-137ffe9a8d6b 2021 - Master Mali- Segou https://app.geofarmer.org/segou-mali/archives/91830f7f-64da-4d85-9017-fefa559b1223 Visualization of results from Climate-Smart Village (CSV) - 2017-2018-2019-2020
- 14. DATA archives accessible at: • 2017 to 2021: https://dataverse.harvard.edu/dataverse/CCAFSbaseline/?q=CSA+ monitoring
- 15. Household level results in Geofarmer App
- 17. Video tutorial and manual (ongoing) https://www.youtube.com/watch?v=0m01T3CNBEk&t= https://cgspace.cgiar.org/bitstream/ha ndle/10568/107365/Infonote%20Geof armer.pdf?sequence=1&isAllowed=y https://hdl.handle.net/10568/113498 Outputs Results Master thesis NUI-Galway Wageningen https://hdl.handle.net/10568/103471 https://hdl.handle.net/10568/111480 Training materials Manual Outreach
- 18. Thank you!
- 19. Inventories of CSA options and CIS 2016 - Global Dataset CSA/CIS implementation and evaluation across CSVs https://hdl.handle.net/10568/83286 2017 Global Dataset CSA/CIS implementation and evaluation across CSVs https://hdl.handle.net/10568/100237 2019 Global Dataset CSA/CIS implementation and evaluation across CSVs https://hdl.handle.net/10568/111515 * Implementation * Evaluation