CuRious about R in Power BI? End to end R in Power BI for beginners
•
0 likes•337 views

R is a widely used open-source statistical software environment used by over 2 million data scientists and analysts. It is based on the S programming language and is developed by the R Foundation. R provides a flexible and powerful environment for statistical analysis, modeling, and data visualization. Some key advantages include being free, having an extensive community for support, and allowing for automated replication through scripting. However, it also has some drawbacks like having a steep learning curve and scripts sometimes being difficult to understand.
Report
Share


CuRious about R in Power BI? End to end R in Power BI for beginners
- 1. •
- 2. • • • • •
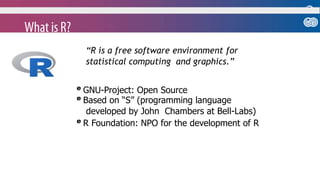
- 12. “R is a free software environment for statistical computing and graphics.” e GNU-Project: Open Source e Based on “S” (programming language developed by John Chambers at Bell-Labs) e R Foundation: NPO for the development of R
- 13. §most widely used data analysis software - used by 2M + data scientist, statisticians and analysts §Most powerful statistical programming language §flexible, extensible and comprehensive for productivity
- 14. • • • •
- 15. • © 2021 Dynamic Communities 15
- 16. • © 2021 Dynamic Communities 16
- 17. Download, save file, double-click 17 © 2021 Dynamic Communities
- 18. Download, save file, double-click 18 © 2021 Dynamic Communities
- 19. Download, save file, double-click 19 © 2021 Dynamic Communities
- 20. Download, save file, double-click 20 © 2021 Dynamic Communities
- 22. • Mean – this is the average • Median – splits the data in two halves • Mode – the most popular value
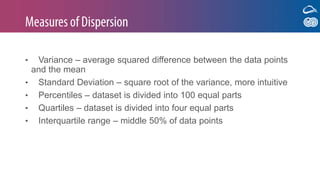
- 23. • Variance – average squared difference between the data points and the mean • Standard Deviation – square root of the variance, more intuitive • Percentiles – dataset is divided into 100 equal parts • Quartiles – dataset is divided into four equal parts • Interquartile range – middle 50% of data points
- 24. Advantages • Free • “Lingua franca” in methodological research: new statistical procedures are often developed with R • Large community: most problems are discussed on the internet • No “point and click”: scripts make procedures transparent and reproducible • Flexible programming allows for automated replication with new data
- 25. Drawbacks • Not very intuitive • No “Point and Click”: handling only through command line and scripts • Documentation is very technical at times • Community-based: different developers (different, lacking compatibility) • Slow with very large data sets
- 27. Enter from command line Ctrl + Enter from script Assign variables: x <- 2 Comments: # Comment Comment selection with Ctrl + Shift + c
- 28. FunctionName (arguments) Function Effect summary(x) str(x) head(x) tail(x) sum(x) mean(x) Summary information on x Structure of x Shows first 6 elements of x Shows last 6 elements of x Calculates the sum of a numeric vector Calculates the arithmetic mean
- 30. Class Example integer numeric character logical factor date complex 1, 2, 3 1.414, 3.14, 1.0 A, B, C TRUE, FALSE “A”, “1”, “rather correct” date complex numbers
- 31. sum(x) Sum of all elements mean(x) Mean of all elements prod(x) Product of all elements of x diff(x) x2 − x1, x3 − x2, x4 − x3 etc.
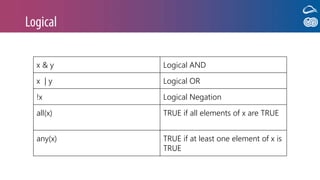
- 32. x & y Logical AND x | y Logical OR !x Logical Negation all(x) TRUE if all elements of x are TRUE any(x) TRUE if at least one element of x is TRUE
- 33. == Is equal to != Is not equal to <,> Smaller than, Larger Than <=, >= Smaller or equal, larger or equal x in y Elements of x in y
- 37. ls <- list (1, 2, 3) print (ls)
- 38. mx <- matrix (1:16, nrow = 4, ncol = 4) print (mx)
- 39. • • • •
- 40. str(df)
- 41. names dim
- 43. • •
- 44. Code Description y ~ x y ~ x1 + x2 y ~ x1 + x2 + 0 y ~ I(x1 + x2) y ~ . - x1 y ~ x1 * x2 x has an effect on y x1 and x2 have an effect on y intercept set to zero y is influenced by x1 plus x2 model of all variables except x1 interaction between x1 and x2
- 45. • • • • • • • •
- 46. Let’s see the data!
- 48. Let’s see the data! Remember to press the ‘Run’ button or select CTRL + ENTER to run the command
- 49. Results!
- 50. Let’s see the data! This creates a new table called PerfectDiamonds. SELECT statements allow you to choose the columns you want.
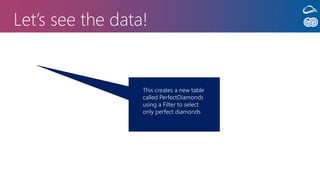
- 51. Let’s see the data! This creates a new table called PerfectDiamonds using a Filter to select only perfect diamonds
- 54. Add in an R component
- 55. Add in an R component
- 56. Script Component Appears in the Power BI Canvas R Script goes here
- 57. Script Component Appears in the Power BI Canvas R Script goes here
- 58. • • • •
- 59. 10 20 30 2 3 4 5 6 7 displ ct y
- 60. 0.0 0.1 0.2 0.3 2 3 4 5 6 7 displ densit y as.factor(year) 1999 2008 ggplot (data = mpg, aes (x = displ)) + geom_density (aes (fill = as.factor(year)), alpha=0.5)
- 61. • • • •
- 62. • • •
- 64. • • •
- 65. With ggmap map graphics can be generated.
- 66. • • •
- 68. • • •
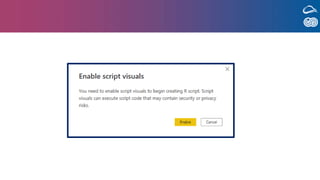
- 76. Tidy code is easier to write, read, maintain and frequently even faster than the base R counterparts. It is also easier to learn. So here we are!
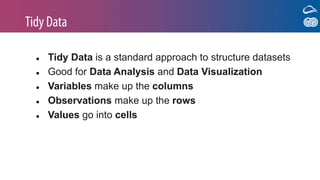
- 77. ● Tidy Data is a standard approach to structure datasets ● Good for Data Analysis and Data Visualization ● Variables make up the columns ● Observations make up the rows ● Values go into cells
- 78. ● A Variable is a measurement ● Also known as: ● Independent or dependent variables ● Features – this is Microsoft’s terminology ● Predictors – (machine learning background) ● Outcomes – (social sciences background) ● The Response (if you have a statistics background) ● Attributes (if you have a dimensional modelling background)
- 79. ● A Variable can fall into three categories: ● Fixed Variables ● Known variables prior to the start of the investigation ● Measured Variables ● Data that’s captured during the investigative process ● Derived Variables ● Think of a calculated column in DAX or SQL
- 80. ● Ingests data from different sources ● There are lots of options to work with the file ● Headers ● Limiters ● https://cran.r-project.org/web/packages/readr/readr.pdf for more information
- 81. ● Easy data manipulation ● Built for data frames ● There are equivalents in SQL ● Written in C++ so it’s faster
- 82. ● 6 verbs for data manipulation ● Select ● Filter ● Mutate ● group_by ● Summarize ● Tally ● There are equivalents in SQL
- 84. • • • • •
- 85. • • •
- 89. ♡ ♡
- 91. • • •