


DA-Module 1.pptx
- 2. Introduction to Big data • Data are everywhere. • IBM projects that every day 2.5 quintillion bytes of data was generated • 90 percent of the data has been created in the last two years. • 85 percent of organizations will be unable to exploit big data for competitive advantage. • 4.4 million jobs will be created around big data
- 3. Largest Data Sets Analysis by KDnuggets Data Size Percentage Less than 1 MB (12) 3.3 1.1 to 10 MB (8) 2.5 11 to 100 MB (14) 4.3 101 MB to 1 GB (50) 15.5 1.1 to 10 GB (59) 18 11 to 100 GB (52) 16 101 GB to 1 TB(59) 18 1.1 to 10 TB (39) 12 11 to 100 TB (15) 4.7 101 TB to 1 PB (6) 1.9 1.1 to 10 PB (2) 0.6 11 to 100 PB (0) 0 Over 100 PetaByte (6) 1.9
- 4. Example Applications • Mail box analysis • Internet Bill • Electricity Bill • Social Media
- 6. ANALYTICS • Analytics is a term that is often used interchangeably with data science, data mining and knowledge discovery. • It refers to extracting useful business patterns or mathematical decision models from a preprocessed data set. • Different underlying techniques can be used for this purpose, • Statistics (Linear and logistics regression) • Machine Learning (Decision tree) • Biology (Neural Network) • Kernel Methods (SVM)
- 7. Predictive and Descriptive - Distinction • Predictive • Target is available • Categorical or continues • Descriptive • Target is not available • Association rules, Sequence rules, and Clustering
- 8. Analytical Model Requirements • A first critical success factor is business relevance • The analytical model should actually solve the business problem for which it was developed. • It makes no sense to have a working analytical model that got sidetracked from the original problem statement. • In order to achieve business relevance, the business problem to be solved is appropriately defined, qualified, and agreed upon by all parties involved at the outset of the analysis.
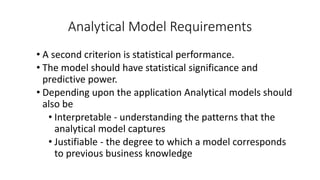
- 9. Analytical Model Requirements • A second criterion is statistical performance. • The model should have statistical significance and predictive power. • Depending upon the application Analytical models should also be • Interpretable - understanding the patterns that the analytical model captures • Justifiable - the degree to which a model corresponds to previous business knowledge
- 10. Analytical Model Requirements • Analytical models should also be operationally efficient. • the efforts needed to collect the data, • preprocess the model, • evaluate the model • feed its outputs to the business application • The economic cost needed to set up the analytical model • Analytical models should also comply with both local and international regulation.
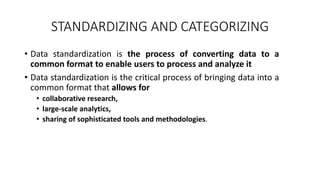
- 11. STANDARDIZING AND CATEGORIZING • Data standardization is the process of converting data to a common format to enable users to process and analyze it • Data standardization is the critical process of bringing data into a common format that allows for • collaborative research, • large-scale analytics, • sharing of sophisticated tools and methodologies.
- 12. Steps to standardize data • Four steps to standardize customer data for better insights • Step 1: Conduct a data source audit. • Step 2: Define standards for data formats. • Step 3: Standardize the format of external data sources. • Step 4: Standardize existing data in the database.
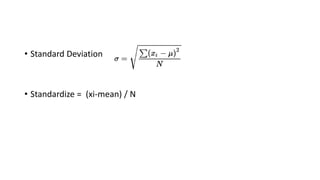
- 13. • Standard Deviation • Standardize = (xi-mean) / N
- 14. CATEGORIZATION • Categorization is a major component of qualitative data analysis by which investigators attempt to group patterns observed in the data into meaningful units or categories. • Categorization is also referred as coarse classification, classing, grouping, binning, etc. • For categorical variables, it is needed to reduce the number of categories. • E.g. Purpose of loan – has 50 values. • 49 dummy variables are needed to estimate one variable.
- 15. Categorization Methods • Two very basic methods are used for categorization. • equal interval binning • equal frequency binning. • Consider, for example, the income values 1,000, 1,200, 1,300, 2,000, 1,800, and 1,400. • Equal interval binning would create two bins with the same range—Bin 1: 1,000, 1,500 and • Bin 2: 1,500, 2,000 • Equal frequency binning would create two bins with the same number of observations— • Bin 1: 1,000, 1,200, 1,300; • Bin 2: 1,400, 1,800,2,000.
- 16. Weight of Evidence Coding • Variable transformation of independent variables. • Used for grouping, variable selection etc. • The weight of evidence tells the predictive power of an independent variable in relation to the dependent variable.
- 17. Weight of Evidence Coding • Example: Predict good or bad customer based on age or income • Model 1: • Customer type = a + b (income) ----> Predicts 70% correctly • Model 2: • Customer type = a + b (age) ----> Predicts 60% correctly • So the ability of “income” to separate good and bad is more than “age” and hence the weight
- 18. Weight of Evidence Coding • Definition: • Since it evolved from credit scoring world, it is generally described as a measure of the separation of good and bad customers. • "Bad Customers" refers to the customers who defaulted on a loan. and "Good Customers" refers to the customers who paid back loan. • Positive WOE means Distribution of Goods > Distribution of Bad’s Negative WOE means Distribution of Goods < Distribution of Bad’s
- 19. Weight of Evidence Coding
- 20. DATA SEGMENTATION • Sometimes data is segmented before the analytical modeling starts. • The segmentation can be conducted • using the experience and knowledge from a business expert • based on statistical analysis using decision trees, k‐means, or self‐organizing maps • Segmentation is used to estimate different analytical models each personalized to a specific segment. • This process must be done careful because it may lead to increase the production, monitoring and maintenance cost.
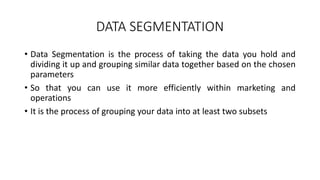
- 21. DATA SEGMENTATION • Data Segmentation is the process of taking the data you hold and dividing it up and grouping similar data together based on the chosen parameters • So that you can use it more efficiently within marketing and operations • It is the process of grouping your data into at least two subsets
- 22. F TEST • The F-test is used to carry out the test for the equality of the two population variances. • If a researcher wants to test whether or not two independent samples have been drawn from a normal population with the same variability, then he generally employs the F-test.
- 23. F-TEST • It is a statistical test used to compare any two different data sets • It gives the mean, variance, observations etc details • F-Test : • compares your model with zero predictor variables and decides whether your added coefficients improved the model.
- 24. T-distribution • The t-distribution is used as an alternative to the normal distribution when sample sizes are small in order to estimate confidence • It also determine critical values that an observation is a given distance from the mean.