


Data analysis & interpretation
- 1. Data Analysis & Interpretation The data, collected for research, has to be processed, analyzed and interpreted to develop a solution to the research question. Data analysis is a practice in which unorganized or unfinished data is ordered and organized so that useful information can be extracted from it. It is the most enjoyable part of carrying out the research since after all of the hard works and waiting the researcher gets the chance to find out the answers. So analyzing the data and interpreting the results are the “reward” for the work of collecting the data.
- 2. Types of Data analysis Data analysis can be categorized into two: Descriptive analysis Inferential analysis
- 3. Descriptive analysis Descriptive analysis describe the main features of a collection of data quantitatively Provides simple summaries about the sample and the measures Descriptive analysis includes the numbers, tables, charts, and graphs used to describe, organize, summarize, and present raw data Describes the frequency and/or percentage distribution of a single variable Tells how many and what percent Example:33% of the respondents are male and 67% are female
- 4. …….Descriptive analysis Descriptive analysis are most often used to examine: - Central tendency of data, i.e. where data tend to fall, as measured by the mean, median, and mode. - Dispersion of data, i.e. how spread out data are, as measured by the variance and the standard deviation. - Skew of data, i.e. how concentrated data are at the low or high end of the scale, as measured by the skew index. - Kurtosis of data, i.e. how concentrated data are around a single value, as measured by the kurtosis index.
- 5. Inferential analysis Inferential analysis is the process of drawing conclusions from data that are subject to random variation Used to analyze data from randomly selected samples Used to try to infer from the sample data what the population might think Risk of error because your sample may be different from the population as a whole To make an inference, you first need to estimate the probability of that error
- 6. …..With descriptive analysis you are simply describing what is or what the data shows. With inferential analysis, you are trying to reach conclusions that extend beyond the immediate data alone. we use inferential analysis to make judgments of the probability that an observed difference between groups is a dependable one or one that might have happened by chance in this study. Thus, we use inferential analysis to make inferences from our data to more general conditions; we use descriptive analysis simply to describe what's going on in our data.
- 7. Interpretation After collecting and analyzing data, the researcher has to accomplish the task of drawing inferences. It has to be done very carefully, otherwise misleading conclusions may be drawn. It is through the task of interpretation the researcher draws inferences from the collected facts.
- 8. ….Interpretation Need of Interpretation Usefulness and utility of research findings lie in proper interpretation Researcher can well understand the principle that works beneath his findings Leads to the establishment of explanatory concepts for future research Researcher can better appreciate what and why his findings are..
- 9. Tabulation Tabulation is the process of arranging data in systematic manner in the form of rows and columns. Classified data is condensed in the form of a table so that it may be more easily understood. The main objective of tabulation is to systematize data and make them simple and comparable.
- 10. ….Tabulation Objectives To simplify complex data To facilitate comparison To economize space To facilitate statistical analysis To facilitate presentation
- 11. ….Tabulation The most important thing about a table is that it should clearly communicate information. To achieve this there are certain conventions that must be followed. Tables must be clear and easy to read Must be ruled or presented as a computer generated table an of an appropriate size for the information.
- 12. ….Tabulation Must have a title which describes the data in the table. This title should be underlined or in bold type. Columns and rows should be clearly headed. When appropriate the left column or top row should contain the independent variable and the bottom row or right column should contain the dependent variable.
- 13. ….Tabulation Units should be displayed in column / row headings only. Missing values should be displayed as -, and zeros as 0. Thee should be no blanks in a table conveying experimental results. Numbers should be listed neatly below each other and should be to the same number of decimal places.
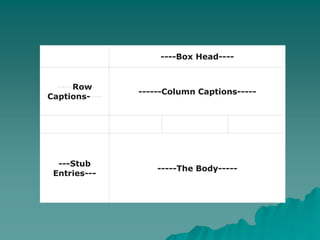
- 14. ….Tabulation Main parts of a table Table No. Title of table Captions Stubs Body of the table Head notes Foot notes Source note
- 16. ----Box Head---- ----Row Captions---- ------Column Captions----- ---Stub Entries--- -----The Body-----
- 17. Generalization In research, once the data is properly arranged using tabulation, it starts showing some pattern. On the basis of this pattern, the researcher may assume about the nature of the population. The process of making such assumptions is known as generalization.
- 18. ….Generalization It is a broad statement about the population based on provided information, observations and experiences A valid generalization is build on - supporting facts - several examples - past experiences - logic and reasoning For a valid generalization, the sample drawn should be typical and representative.
- 19. ….Generalization Types of Generalization Valid generalizations Faulty generalizations
- 20. ….Generalization Valid generalizations Supported by facts Agrees with what you already know about the topic Uses logic and reasoning Proven with several examples
- 21. ….Generalization Faulty generalizations Not supported by facts Watch for the key words: none, all, always, never, everyone, nobody