Location via proxy:   [ UP ]  
[Report a bug]   [Manage cookies]                
SlideShare a Scribd company logo

1

Data Analysis Using SPSS t-test

2

t-test Used to test whether there is significant difference between the means of two groups, e.g.: Male v female  Full-time v part-time

3

t-test Typical hypotheses for t-test: There is no difference in affective commitment (affcomm) between male and female employees There is no difference in continuance  commitment (concomm) between male and female employees There is no difference in normative commitment (norcomm) between male and female employees

4

Performing T-test Analyze  ->  Compare Means ->  Independent-Samples T-test

5


6


7

Performing T-test Select the variables to test (Test Variables), in this case: affcomm concomm norcomm And bring the variables to the “Test Variables” box

8


9


10

Performing T-test Select the grouping variable, i.e. gender; bring it to the “grouping variable” box Click “Define Groups”

11


12

Performing T-test Choose “Use specified values” Key in the codes for the variable “gender” as used in the “Value Labels”. In this case: 1 - Male 2 -  Female  Click “Continue”, then “OK”

13


14

T-Test: SPSS Output

15

T-test: SPSS Output

16

From the SPSS output, we are able to see that the means of the respective variables for the two groups are: Affective commitment (affcomm)  Male 3.49720 Female 3.38016 Continuance commitment (concomm) Male 3.18838 Female 3.15159 Normative commitment (norcomm) Male 3.24090 Female 3.27540

17

T-test: Interpretation For the variable “affcomm” Levene’s Test for Equality of Variances shows that F (1.048) is not significant (0.306)* therefore the “Equal variances assumed” row will be used for the t-test. * This score (sig.) has to be 0.05 or less to be considered significant.

18

T-test: Interpretation Under the “t-test for Equality of Means” look at “Sig. (2-tailed)” for “Equal variances assumed”.  The score is 0.035 (which is less than 0.05), therefore there is a significant difference between the means of the two groups.

19

T-test: Interpretation

20

T-test: Interpretation For the variable “concomm” Levene’s Test for Equality of Variances shows that F (5.353) is significant (0.021)* therefore the “Equal variances not assumed” row will be used for the t-test. * This score (sig.) is less than 0.05, so there is significant different in the variances of the two groups.

21

T-test: Interpretation Under the “t-test for Equality of Means” look at “Sig. (2-tailed)” for “Equal variances not assumed”.  The score is 0.503 (which is more than 0.05), therefore there is no significant difference between the means of the two groups.

22

T-test: Interpretation

23

T-test: Interpretation For the variable “norcomm” Levene’s Test for Equality of Variances shows that F (0.656) is not significant (0.418)* therefore the “Equal variances are assumed” row will be used for the t-test. * This score (sig.) is more than 0.05, so there is no significant different in the variances of the two groups.

24

T-test: Interpretation Under the “t-test for Equality of Means” look at “Sig. (2-tailed)” for “Equal variances assumed”.  The score is 0.497 (which is more than 0.05), therefore there is no significant difference between the means of the two groups.

More Related Content

Data Analysis Using Spss T Test

  • 1. Data Analysis Using SPSS t-test
  • 2. t-test Used to test whether there is significant difference between the means of two groups, e.g.: Male v female Full-time v part-time
  • 3. t-test Typical hypotheses for t-test: There is no difference in affective commitment (affcomm) between male and female employees There is no difference in continuance commitment (concomm) between male and female employees There is no difference in normative commitment (norcomm) between male and female employees
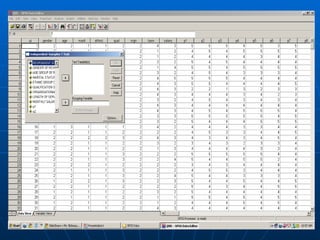
  • 4. Performing T-test Analyze -> Compare Means -> Independent-Samples T-test
  • 5.  
  • 6.  
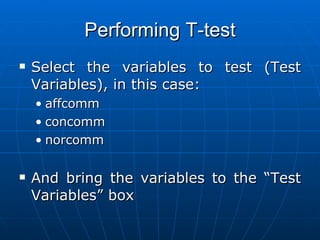
  • 7. Performing T-test Select the variables to test (Test Variables), in this case: affcomm concomm norcomm And bring the variables to the “Test Variables” box
  • 8.  
  • 9.  
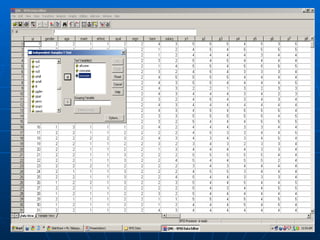
  • 10. Performing T-test Select the grouping variable, i.e. gender; bring it to the “grouping variable” box Click “Define Groups”
  • 11.  
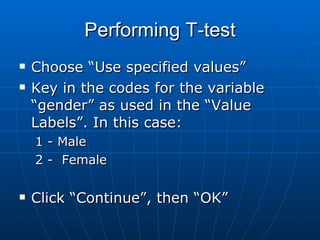
  • 12. Performing T-test Choose “Use specified values” Key in the codes for the variable “gender” as used in the “Value Labels”. In this case: 1 - Male 2 - Female Click “Continue”, then “OK”
  • 13.  
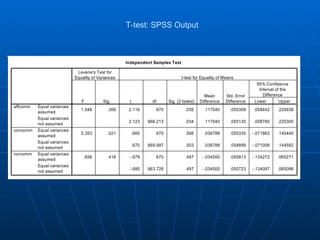
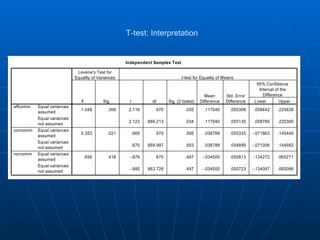
  • 16. From the SPSS output, we are able to see that the means of the respective variables for the two groups are: Affective commitment (affcomm) Male 3.49720 Female 3.38016 Continuance commitment (concomm) Male 3.18838 Female 3.15159 Normative commitment (norcomm) Male 3.24090 Female 3.27540
  • 17. T-test: Interpretation For the variable “affcomm” Levene’s Test for Equality of Variances shows that F (1.048) is not significant (0.306)* therefore the “Equal variances assumed” row will be used for the t-test. * This score (sig.) has to be 0.05 or less to be considered significant.
  • 18. T-test: Interpretation Under the “t-test for Equality of Means” look at “Sig. (2-tailed)” for “Equal variances assumed”. The score is 0.035 (which is less than 0.05), therefore there is a significant difference between the means of the two groups.
  • 20. T-test: Interpretation For the variable “concomm” Levene’s Test for Equality of Variances shows that F (5.353) is significant (0.021)* therefore the “Equal variances not assumed” row will be used for the t-test. * This score (sig.) is less than 0.05, so there is significant different in the variances of the two groups.
  • 21. T-test: Interpretation Under the “t-test for Equality of Means” look at “Sig. (2-tailed)” for “Equal variances not assumed”. The score is 0.503 (which is more than 0.05), therefore there is no significant difference between the means of the two groups.
  • 23. T-test: Interpretation For the variable “norcomm” Levene’s Test for Equality of Variances shows that F (0.656) is not significant (0.418)* therefore the “Equal variances are assumed” row will be used for the t-test. * This score (sig.) is more than 0.05, so there is no significant different in the variances of the two groups.
  • 24. T-test: Interpretation Under the “t-test for Equality of Means” look at “Sig. (2-tailed)” for “Equal variances assumed”. The score is 0.497 (which is more than 0.05), therefore there is no significant difference between the means of the two groups.