


Data analytcis-first-steps
- 1. FIRST STEPS IN DATASCIENCE Tips and tools for wannabe data analysts By Sheshachalam Ratnala
- 2. Data analytics Aka Machine Learning Data analytics as an area where the available digital data is treated as a Gold Mine from where tangible output is obtained which when applied impacts businesses and it’s efficiency. Machine Learning is the tool in the form of y=f(x) which co-relates all the parameters in the data to obtain the relation which it learns from these parameters and keeps on improving the relationship 2
- 3. Data analytics Aka Machine Learning` Data : It is a set of values of quantitative and qualitative variables. Historic information or knowledge represented in usable form Population - Entire group It’s the collection of data which represents whole of the problem domain Sample - A portion of the group Subset of the population to be taken for inference which is the true representation of the overall population 3
- 4. Data analytics – How to start Data Science/Data analytics With what ever name it’s been known to you has essentially 3 areas to cover Business StatisticsProgramming 4
- 5. Data analytics – How to start Business – Critical thinking 1. Objective analysis and evaluation of an issue in order to form a judgement 2. This is the stage to build the hypothesis for the problem domain in context 3. The model below could be a way to follow 5
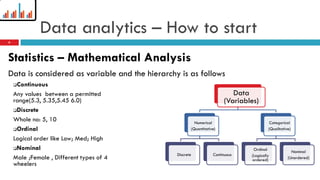
- 6. Data analytics – How to start Statistics – Mathematical Analysis Data is considered as variable and the hierarchy is as follows Data (Variables) Numerical (Quantitative) Discrete Continuous Categorical (Qualitative) Ordinal (Logically ordered) Nominal (Unordered) Continuous Any values between a permitted range(5.3, 5.35,5.45 6.0) Discrete Whole no: 5, 10 Ordinal Logical order like Low; Med; High Nominal Male ;Female , Different types of 4 wheelers 6
- 7. Data analytics – How to start Programming - Execution R is the widely used tool due it’s historical statistical usage and it’s abundant statistical libraries Python the interpreted language provides a wide variety of packages for application development and it’s statistical library . Data ingestion Tools: Spark, Hadoop 7
- 8. Data analytics – Problem perspective Solution Hypothesis Supervised Learning Numerical Data (Target Variable) Regression Linear Regression Time Series Categorical data (Target Variable) Classification Decision Trees Random Forest K NN Logistic Regression Demand Forecasting Reinforcement learning Semi-Supervised NLP and AI Unsupervised Clustering K Means Hierarchical clustering Dimensionality Reduction Collaborative filtering 8 Classifying the problem
- 9. Data analytics – Problem Complexity The solution complexity and data volume increases with the kind of business value being generated Credits : odoscope: Overview of analytics methods 9
- 10. Data analytics – The execution Basic Terminology • Attribute - Features are a quantitative attributes of the samples being observed • Axis - Features are orthogonal axes of their feature space, if they are linearly independent • Column/Independent variables - Features are represented as columns in your dataset • Dimension - A dataset's features, grouped together can be treated as a n-dimensional coordinate space • Input - Feature values are the input of data-driven, machine learning algorithms • Predictor/Dependent variable - Features used to predict other attributes are called predictors • View - Each feature conveys a quantitative trait or perspective about the sample being observed • Independent Variable - Autonomous features used to calculate others are like independent variables in algebraic equations Structuring the data 10
- 11. Data analytics – The execution The rule of Seven The steps are iterative at any stage • Data collection(Problem context) • Data Wrangling/Data Munging(Data cleaning) • Data exploring/Analysis • Data Transforming • Modelling • Model evaluation • Data Visualization( Intelligence) The machine learning models works only on clean structured data . 5 out of 7 steps are related to pre-processing of the data given to model. 11
- 12. Data analytics – The execution 1. Data collection /selection 1.No bias in the data feature 2.Relevant data feature 3.Techniques to handle a) Data Collection: 1. Data from sources related to problem i..e DB’s,Weblogs,emails etc.. 2. Any audio,video,sensor data etc . 3. The 6 Vs of data , Variety ,Velocity,Verasity,Volume,Value,Viable b) Data Selection: 1. PCA : Unsupervised data 2.LDA (Linear discrimant analysis) : Supervised data The rule of Seven 12
- 13. Data analytics – The execution 2. Data cleaning (Garbage in Garbage Out) 1. Data obtained is not clean and have below issues: 1. Outliers 4. Erroneous data7. Need formatting 2. Missing data 5. Irrelevant data 3. Malicious data 6. Inconsistent data 2. Techniques to handle 1.Impute values by Mean ,Median or Mode 2. Treat outliers by deleting the row if not at all related else analyze with more data 3.Binning 4.Creating new features from given features 5.Dummy variables The rule of Seven 13
- 14. Data analytics – The execution 3. Data Analysis (Data exploring) 1.Find the relevance of the feature set. Apply all the basic statistical exploration i..e moments 2. Obtain the statistical relation. 3.Perform basic visualizations for obtaining the concrete feature set. 4.Techniques to handle 1.Univariate analysis ( Mean ,mode, Normal distrubution,Variance,Skewness,Kurtosis) 2.Bi-Variate analysis ( Scatter plot, Box plot, Histogram) 3.Multi-variate analysis (Probability distribution functions PDFs) The rule of Seven 14
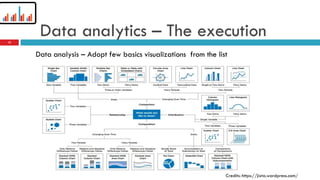
- 15. Credits: https://jixta.wordpress.com/ Data analytics – The execution Data analysis – Adopt few basics visualizations from the list 15
- 16. Data analytics – The execution 4. Data Transformation(Data on the same scale) 1. Ensure that the rest of the features are informative and transformation changes the no. of features or the feature values. This is also known as Feature engineering 2. Dimensionality Reduction 3. Curse of dimensionality 4. Techniques to handle 1.PCA : Principal component analysis 2.Kernel Trick 3.Normalization The rule of Seven 16
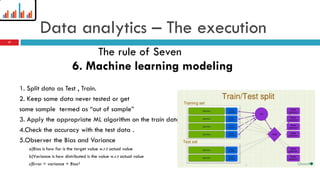
- 17. Data analytics – The execution 6. Machine learning modeling 1. Split data as Test , Train. 2. Keep some data never tested or get some sample termed as “out of sample” 3. Apply the appropriate ML algorithm on the train data. 4.Check the accuracy with the test data . 5.Observer the Bias and Variance a)Bias is how far is the target value w.r.t actual value b)Variance is how distributed is the value w.r.t actual value c)Error = variance + Bias² The rule of Seven 17
- 18. Data analytics – The execution The rule of Seven 6.1 Machine learning modeling 2.Apply the appropriate algorithm as described by solution hypothesis Ref: cheatsheet 18
- 19. Data analytics – The execution 6.2 Machine learning model 1. Model Performance 1. Model validation 1. MSE ( Mean square error) 2. Hypothesis testing 3.Cross-validation 2. Algorithm tuning 1.Tuning the co-efficient parameters 2..Increasing the splits 3. Feature engineering (iterate again for features) 4. Cross validation 1. K-Fold 5. Ensemble method ( Combining the ML algorithms) 1. Voting ( Selection based on voting on performance) 2.Bagging( Bootstrapping + Aggregating) 3.Boosting (Weak learner to strong learner. The rule of Seven 19
- 20. Data analytics Aka Machine Learning 6.3.1 Machine learning model performance 1. Confusion matrix ( Hypothesis testing Measurement terms 1. Precision 3.Accuracy 5.False positive(Fallout-rate) 2. Recall 4.Specificity 6.False negative (Miss rate) 20 The rule of Seven
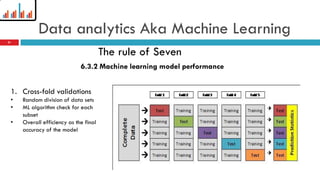
- 21. Data analytics Aka Machine Learning 6.3.2 Machine learning model performance 1. Cross-fold validations • Random division of data sets • ML algorithm check for each subset • Overall efficiency as the final accuracy of the model 21 The rule of Seven
- 22. Data analytics Aka Machine Learning 7. Data Visualization 1. Storifying the data analysis as Descriptive ,prescriptive or predictive 2. Effective use of the visuals graphs. 3.Tools like Tableau ,D3.js ,Matplotlib,chart.js 22 The rule of Seven
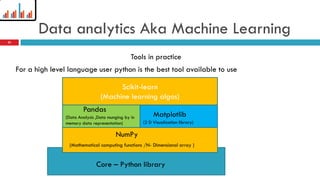
- 23. Data analytics Aka Machine Learning Tools in practice Core – Python library NumPy Pandas Matplotlib Scikit-learn (Machine learning algos) (Mathematical computing functions /N- Dimensional array ) (Data Analysis ,Data munging by in memory data representation) (2 D Visualization library) For a high level language user python is the best tool available to use 23
- 24. Data analytics Aka Machine Learning Tools sources 1. Anaconda 1. Use IPython universal editor 2. Python 2.7+ or 3.5 3. Careful about the version because of supporting function 4. A good starting tool 5. Spyder Interactive editor tool for basic python learning 2. Enthought Canopy. 1. Interactive environment 3. Pycharm by jetbrains : Interactive IDE debugger tool 24
- 25. Data analytics Aka Machine Learning Tools cheat sheets Must visit sites KdNuggets Kaggle DatascienceCentral DataCamp https://www.class-central.com/ http://analyticsvidhya.com/ https://www.odsc.com/ http://www.pythonlearn.com/ http://datascienceplus.com/ Practice data sets http://ipython-books.github.io/minibook/ http://learnds.com/ https://vincentarelbundock.github.io/Rdatasets/ 25
- 26. Thank you !!! Connect with me at r.shera01@gmail.com 26