Location via proxy:   [ UP ]  
[Report a bug]   [Manage cookies]                
SlideShare a Scribd company logo
Data-Driven
Decision Making
Burn-Down Charts Tell Stories 

viz. Team Performance Indicators

Are you listening?
Release Burn Down
Looking at a release burn down, we
should be able to answer the following
questions easily.
How much work was added?
How much work was completed?
How much work remained in
progress?
What is the forecast?
Is there a pattern here?
Is the unit of work truly
representative?
We use a release burn down for this
analysis because it gives us long
enough trajectory to measure and state
quantifiable facts about the performance
of a team.
!2
Quarterly Release Burn-down
Sprint 1
Sprint 2
Sprint 3
Sprint 4
Sprint 5
Sprint 6
Story Points
0 75 150 225 300
30
88
20
110
113
137
101
150
95
53
51
55
18
15
17
Completed
Remaining
Added
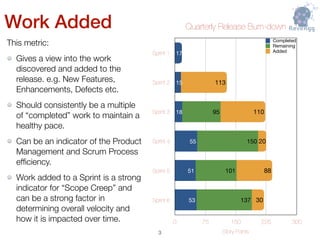
Work Added
This metric:
Gives a view into the work
discovered and added to the
release. e.g. New Features,
Enhancements, Defects etc.
Should consistently be a multiple
of “completed” work to maintain a
healthy pace.
Can be an indicator of the Product
Management and Scrum Process
efficiency.
Work added to a Sprint is a strong
indicator for “Scope Creep” and
can be a strong factor in
determining overall velocity and
how it is impacted over time.
Quarterly Release Burn-down
Sprint 1
Sprint 2
Sprint 3
Sprint 4
Sprint 5
Sprint 6
Story Points
0 75 150 225 300
30
88
20
110
113
137
101
150
95
53
51
55
18
15
17
Completed
Remaining
Added
!3
Work Completed
This metric:
Gives a view into the average
velocity of a team as the time
progresses.
There is no baseline to compare this
against - except a rolling average
over three sprints might give a
pretty reasonable predictability.
In this illustration - the team seems
to have improved the velocity after first
three sprints - which can be
interpreted as a period of major
impediments like poor requirements,
capacity shortage, technical difficulties
or other variables that need triaging
and a good understanding of the
context.
Quarterly Release Burn-down
Sprint 1
Sprint 2
Sprint 3
Sprint 4
Sprint 5
Sprint 6
Story Points
0 75 150 225 300
30
88
20
110
113
137
101
150
95
53
51
55
18
15
17
Completed
Remaining
Added
!4
Work Pending
This metric:
Tells us the debt to be rolled over
to the next Sprint.
Scope Creeps can cause a huge
carry-over of debt making the
quality of estimates to be very
poor.
Should drive the capacity demand
and fulfillment.
In this illustration - the team seems
to have been either over-allocated
OR under-resourced, constantly
catching up to the debt. Additionally,
healthy pipeline of new work just
seems to be piling up the debt
consistently from Sprint to Sprint.
Quarterly Release Burn-down
Sprint 1
Sprint 2
Sprint 3
Sprint 4
Sprint 5
Sprint 6
Story Points
0 75 150 225 300
30
88
20
110
113
137
101
150
95
53
51
55
18
15
17
Completed
Remaining
Added
!5
Work Forecast
There is no direct forecast possible
except for using the velocity and total
debt as an indicator for a “no-change”
forecast.
Velocity: Rolling Average of
Completed Work in the past three
Sprints.
Total Debt: Remaining work +
Added work in the current Sprint.
“No-Change” Forecast: Total Debt /
Velocity
“No-Change” here implies the team will
not see any additional work or
impediments. No change in capacity.
“Forecast” is the number of Sprints it
will take to finish the remaining work
given there is “no-change”.
Quarterly Release Burn-down
Sprint 1
Sprint 2
Sprint 3
Sprint 4
Sprint 5
Sprint 6
Story Points
0 75 150 225 300
30
88
20
110
113
137
101
150
95
53
51
55
18
15
17
Completed
Remaining
Added
!6
Team Performance Indicators (TPI)
• Velocity - Story Point Burn Rate - Gives a quantifiable way to measure how much work
is being delivered in each Sprint.
• Rolling Avg. Velocity - Avg. Burn Rate - A rolling average of velocity (usually over last
2-3 sprints) gives a more reasonable number for estimating a timeline for remaining
work.
• Debt - Outstanding Planned Work - Unfinished outstanding work that is directly tied to
the completion of the quarterly goals.
• Scope Creep - Unplanned Work - New work added to a Sprint (after the start of the
sprint) as a proportion of the original work assigned to the team (before the sprint start.)
• Story Point - Unit of work - Usually measured in time - in the illustration shown in this
deck, 1 Story Point is equal to 8 hours of uninterrupted work clocked against a single
User Story, Defect or Enhancement.
• Sprint - Length of Time - Usually two weeks or 10 business days, with a total expected
story points worth of 10 per head.
• Potential Risk - Unsized Unplanned Work - Stories that haven’t been fully discovered
and can’t be planned because of missing requirement details.
• Forecast - Tentative Timeline for Release - Number of sprints it would take to finish all
the Debt, provided there is no change in capacity and no scope-creeps.
TPI Suggestions
Measured As Ideal Baseline Acceptable
Velocity Story Points Per Sprint
80% Total Sprint Story
Points
65% Total Sprint Story
Points
Rolling Avg.
Velocity
Avg. Velocity Last Three
Sprints
Same as above Same as above
Debt Planned Story Points
Resource x Velocity x
Efficiency x X-Factor
2X - 3X of Current Debt.
Scope Creep Unplanned Story Points 5% 20%
Story Point
Time Spent on a Story -
usually 8 hours
Fibonacci Series
Even distribution across
the available time
Sprint 10 business days 10 business days 5 business days
Potential Risk Unsized Story Points Less than 5% Up to 10%
Forecast Sprints Remaining 2-5 Sprints 6-10 Sprints
Thanks!

More Related Content

Data Driven Decision Making - Chapter 1. Team Performance

  • 1. Data-Driven Decision Making Burn-Down Charts Tell Stories viz. Team Performance Indicators Are you listening?
  • 2. Release Burn Down Looking at a release burn down, we should be able to answer the following questions easily. How much work was added? How much work was completed? How much work remained in progress? What is the forecast? Is there a pattern here? Is the unit of work truly representative? We use a release burn down for this analysis because it gives us long enough trajectory to measure and state quantifiable facts about the performance of a team. !2 Quarterly Release Burn-down Sprint 1 Sprint 2 Sprint 3 Sprint 4 Sprint 5 Sprint 6 Story Points 0 75 150 225 300 30 88 20 110 113 137 101 150 95 53 51 55 18 15 17 Completed Remaining Added
  • 3. Work Added This metric: Gives a view into the work discovered and added to the release. e.g. New Features, Enhancements, Defects etc. Should consistently be a multiple of “completed” work to maintain a healthy pace. Can be an indicator of the Product Management and Scrum Process efficiency. Work added to a Sprint is a strong indicator for “Scope Creep” and can be a strong factor in determining overall velocity and how it is impacted over time. Quarterly Release Burn-down Sprint 1 Sprint 2 Sprint 3 Sprint 4 Sprint 5 Sprint 6 Story Points 0 75 150 225 300 30 88 20 110 113 137 101 150 95 53 51 55 18 15 17 Completed Remaining Added !3
  • 4. Work Completed This metric: Gives a view into the average velocity of a team as the time progresses. There is no baseline to compare this against - except a rolling average over three sprints might give a pretty reasonable predictability. In this illustration - the team seems to have improved the velocity after first three sprints - which can be interpreted as a period of major impediments like poor requirements, capacity shortage, technical difficulties or other variables that need triaging and a good understanding of the context. Quarterly Release Burn-down Sprint 1 Sprint 2 Sprint 3 Sprint 4 Sprint 5 Sprint 6 Story Points 0 75 150 225 300 30 88 20 110 113 137 101 150 95 53 51 55 18 15 17 Completed Remaining Added !4
  • 5. Work Pending This metric: Tells us the debt to be rolled over to the next Sprint. Scope Creeps can cause a huge carry-over of debt making the quality of estimates to be very poor. Should drive the capacity demand and fulfillment. In this illustration - the team seems to have been either over-allocated OR under-resourced, constantly catching up to the debt. Additionally, healthy pipeline of new work just seems to be piling up the debt consistently from Sprint to Sprint. Quarterly Release Burn-down Sprint 1 Sprint 2 Sprint 3 Sprint 4 Sprint 5 Sprint 6 Story Points 0 75 150 225 300 30 88 20 110 113 137 101 150 95 53 51 55 18 15 17 Completed Remaining Added !5
  • 6. Work Forecast There is no direct forecast possible except for using the velocity and total debt as an indicator for a “no-change” forecast. Velocity: Rolling Average of Completed Work in the past three Sprints. Total Debt: Remaining work + Added work in the current Sprint. “No-Change” Forecast: Total Debt / Velocity “No-Change” here implies the team will not see any additional work or impediments. No change in capacity. “Forecast” is the number of Sprints it will take to finish the remaining work given there is “no-change”. Quarterly Release Burn-down Sprint 1 Sprint 2 Sprint 3 Sprint 4 Sprint 5 Sprint 6 Story Points 0 75 150 225 300 30 88 20 110 113 137 101 150 95 53 51 55 18 15 17 Completed Remaining Added !6
  • 7. Team Performance Indicators (TPI) • Velocity - Story Point Burn Rate - Gives a quantifiable way to measure how much work is being delivered in each Sprint. • Rolling Avg. Velocity - Avg. Burn Rate - A rolling average of velocity (usually over last 2-3 sprints) gives a more reasonable number for estimating a timeline for remaining work. • Debt - Outstanding Planned Work - Unfinished outstanding work that is directly tied to the completion of the quarterly goals. • Scope Creep - Unplanned Work - New work added to a Sprint (after the start of the sprint) as a proportion of the original work assigned to the team (before the sprint start.) • Story Point - Unit of work - Usually measured in time - in the illustration shown in this deck, 1 Story Point is equal to 8 hours of uninterrupted work clocked against a single User Story, Defect or Enhancement. • Sprint - Length of Time - Usually two weeks or 10 business days, with a total expected story points worth of 10 per head. • Potential Risk - Unsized Unplanned Work - Stories that haven’t been fully discovered and can’t be planned because of missing requirement details. • Forecast - Tentative Timeline for Release - Number of sprints it would take to finish all the Debt, provided there is no change in capacity and no scope-creeps.
  • 8. TPI Suggestions Measured As Ideal Baseline Acceptable Velocity Story Points Per Sprint 80% Total Sprint Story Points 65% Total Sprint Story Points Rolling Avg. Velocity Avg. Velocity Last Three Sprints Same as above Same as above Debt Planned Story Points Resource x Velocity x Efficiency x X-Factor 2X - 3X of Current Debt. Scope Creep Unplanned Story Points 5% 20% Story Point Time Spent on a Story - usually 8 hours Fibonacci Series Even distribution across the available time Sprint 10 business days 10 business days 5 business days Potential Risk Unsized Story Points Less than 5% Up to 10% Forecast Sprints Remaining 2-5 Sprints 6-10 Sprints