Location via proxy:   [ UP ]  
[Report a bug]   [Manage cookies]                
SlideShare a Scribd company logo

1

DATA HANDLING..!!
A.E.C.S - 5
NAME => SAHIL,SUNIT
&
RITESH
CLASS => 8 – P

2

All About Data Handling..!!
•In various fields, we need information in the of numerical figures.
•Each figure of this kind is called an observation.
•The collection of all the observation is called data.
Some important terms are defined below:-
•Data:- A collection of numerical facts regarding a particular type of
information is called data.
•Raw data :- A collection of observation gathered initially is called
raw data.
•Range:- The difference between the highest and the lowest values of
the observation in a data is called the range of the data.
•Statistics:- It is the science which deals with the collection,
presentation, analysis and interpretation of numerical data.

3

Introduction To Frequency Distribution..!!
Example :- Suppose we make survey of 20 families of a locality and find out the
number of children in each family. Let the observation be.
2,2,3,1,1,2,3,2,2,1,2,2,3,1,2,1,1,3,2,2.
State the frequency of each observation.
Solution:- Arranging the data in ascending order, we get the observation as
1,1,1,1,1,1,2,2,2,2,2,2,2,2,2,2,3,3,3.
We find that
1 occurs 6 times;
2 occurs 10 times;
and 3 occurs 4 times;
We say that the frequency of families having 1 child is 6,
the frequency of families having 2 children is 10,
and the frequency of families having 3 children is 4.
We may present the above data is a tabular form, showing the frequency of each
observation. This tabular form of representation is called frequency
distribution.
For counting, we use tally marks l l l l, and the fifth tally mark is entered as llll by
crossing diagonally the four tally marks already entered.
Thus, the frequency distribution table of the above data may be presented
as given in the next slide…………

4

Example For The Frequency Table..!!
No. of
children.
Tally Marks. No. of families
(frequency)
1
2
3
llll l
llll llll
llll
TOTAL
6
10
4
20

5

Bar graphs
0
10
20
30
40
50
60
70
80
90
Hindi English Math's Science
Graph shows marks
Obtained by Kunal in
4 subjects.
SCALE : 1 small div. 1 mark
Subjects
MarksObtained
Y
X

6

Example of Pie Chart..!!
Example :- A man with a monthly salary of
Rs. 10800 plans his budget for month as
given below:
Represent the above data in pie chart..
Item
Amount
(in Rs.)
Food Rent Education Savings Misc.
3150 2100 1950 2400 1200
Solution on next slide ****

7

Solution of the question given in previous slide..!!
Solution :- Total money = Rs. 10800.
Central angle for a component =
( )X 360
Sum of the values of all components
Value of the components
Now I will show the calculation of central angles on next slide
Caution

8

Calculations of central angles..!!
Item Amount ( in Rs.) Central angle
Food 3150
Rent 2100
Education 1950
Saving 2400
Miscellaneous 1200
(
X 360
)
(
X 360
)
(
(
(
X 360
X 360
X 360
)
)
)
3150
2100
1950
2400
1200
10800
10800
10800
10800
10800
= 105`
= 70`
= 65`
= 80`
= 40`

9

How To Make a Pie Chart
Steps of construction:
1. Draw a circle of any convenient radius.
2. Draw a horizontal radius of this circle.
3. Starting form the horizontal radius, draw
sectors whose central angles are
105`,70`,65`,80` and 40` respectively.
4. Shade the sectors so obtained differently and
label each one of them.
Thus, we obtain the required pie chart, as
shown in the given figure. ( fig. in next slide)

10

Pie Chart
Rent
Food
Education
Savings
105`
65`
70`
80`
40`

11

Data handling

More Related Content

Data handling

  • 1. DATA HANDLING..!! A.E.C.S - 5 NAME => SAHIL,SUNIT & RITESH CLASS => 8 – P
  • 2. All About Data Handling..!! •In various fields, we need information in the of numerical figures. •Each figure of this kind is called an observation. •The collection of all the observation is called data. Some important terms are defined below:- •Data:- A collection of numerical facts regarding a particular type of information is called data. •Raw data :- A collection of observation gathered initially is called raw data. •Range:- The difference between the highest and the lowest values of the observation in a data is called the range of the data. •Statistics:- It is the science which deals with the collection, presentation, analysis and interpretation of numerical data.
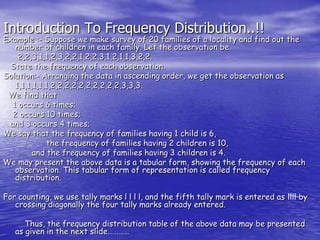
  • 3. Introduction To Frequency Distribution..!! Example :- Suppose we make survey of 20 families of a locality and find out the number of children in each family. Let the observation be. 2,2,3,1,1,2,3,2,2,1,2,2,3,1,2,1,1,3,2,2. State the frequency of each observation. Solution:- Arranging the data in ascending order, we get the observation as 1,1,1,1,1,1,2,2,2,2,2,2,2,2,2,2,3,3,3. We find that 1 occurs 6 times; 2 occurs 10 times; and 3 occurs 4 times; We say that the frequency of families having 1 child is 6, the frequency of families having 2 children is 10, and the frequency of families having 3 children is 4. We may present the above data is a tabular form, showing the frequency of each observation. This tabular form of representation is called frequency distribution. For counting, we use tally marks l l l l, and the fifth tally mark is entered as llll by crossing diagonally the four tally marks already entered. Thus, the frequency distribution table of the above data may be presented as given in the next slide…………
  • 4. Example For The Frequency Table..!! No. of children. Tally Marks. No. of families (frequency) 1 2 3 llll l llll llll llll TOTAL 6 10 4 20
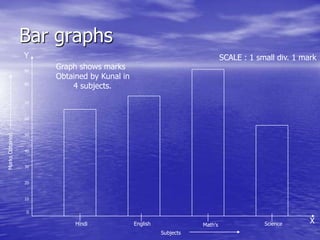
  • 5. Bar graphs 0 10 20 30 40 50 60 70 80 90 Hindi English Math's Science Graph shows marks Obtained by Kunal in 4 subjects. SCALE : 1 small div. 1 mark Subjects MarksObtained Y X
  • 6. Example of Pie Chart..!! Example :- A man with a monthly salary of Rs. 10800 plans his budget for month as given below: Represent the above data in pie chart.. Item Amount (in Rs.) Food Rent Education Savings Misc. 3150 2100 1950 2400 1200 Solution on next slide ****
  • 7. Solution of the question given in previous slide..!! Solution :- Total money = Rs. 10800. Central angle for a component = ( )X 360 Sum of the values of all components Value of the components Now I will show the calculation of central angles on next slide Caution
  • 8. Calculations of central angles..!! Item Amount ( in Rs.) Central angle Food 3150 Rent 2100 Education 1950 Saving 2400 Miscellaneous 1200 ( X 360 ) ( X 360 ) ( ( ( X 360 X 360 X 360 ) ) ) 3150 2100 1950 2400 1200 10800 10800 10800 10800 10800 = 105` = 70` = 65` = 80` = 40`
  • 9. How To Make a Pie Chart Steps of construction: 1. Draw a circle of any convenient radius. 2. Draw a horizontal radius of this circle. 3. Starting form the horizontal radius, draw sectors whose central angles are 105`,70`,65`,80` and 40` respectively. 4. Shade the sectors so obtained differently and label each one of them. Thus, we obtain the required pie chart, as shown in the given figure. ( fig. in next slide)