Data Science - Part II - Working with R & R studio
•
31 likes•6,199 views

This tutorial will go through a basic primer for individuals who want to get started with predictive analytics through downloading the open source (FREE) language R. I will go through some tips to get up and started and building predictive models ASAP.
Report
Share


Data Science - Part II - Working with R & R studio
- 1. Presented by: Derek Kane
- 2. Introduction to the R language Installation and Configuration R Studio Basics Navigation Panes Menu Descriptions R Script Development Installing Packages R Model Components Additional R Tips
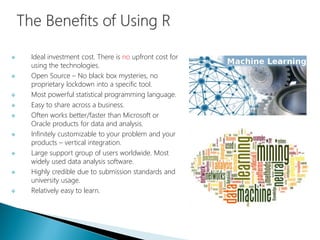
- 3. Ideal investment cost. There is no upfront cost for using the technologies. Open Source – No black box mysteries, no proprietary lockdown into a specific tool. Most powerful statistical programming language. Easy to share across a business. Often works better/faster than Microsoft or Oracle products for data and analysis. Infinitely customizable to your problem and your products – vertical integration. Large support group of users worldwide. Most widely used data analysis software. Highly credible due to submission standards and university usage. Relatively easy to learn.
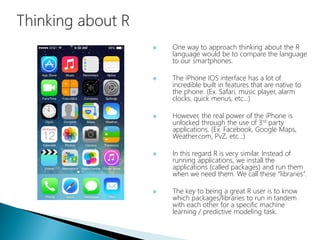
- 4. One way to approach thinking about the R language would be to compare the language to our smartphones. The iPhone IOS interface has a lot of incredible built in features that are native to the phone. (Ex. Safari, music player, alarm clocks, quick menus, etc…) However, the real power of the iPhone is unlocked through the use of 3rd party applications. (Ex. Facebook, Google Maps, Weather.com, PvZ, etc…) In this regard R is very similar. Instead of running applications, we install the applications (called packages) and run them when we need them. We call these “libraries”. The key to being a great R user is to know which packages/libraries to run in tandem with each other for a specific machine learning / predictive modeling task.
- 18. 1 2 3 4
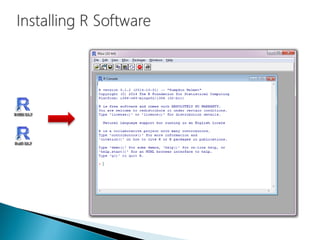
- 19. The pane at the bottom left hand side of the R Management Studio shows the R console as it would appear in the base R environment. This section shows us the executed results of our code as well as any error messages in the execution of our code. We wont actually be performing our work here but this section is critical to review when developing in R.
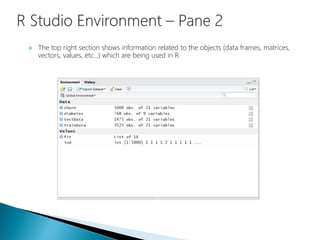
- 20. The top right section shows information related to the objects (data frames, matrices, vectors, values, etc…) which are being used in R.
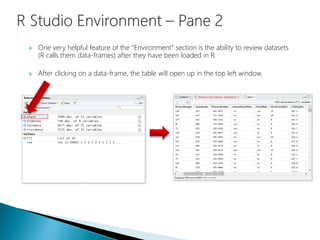
- 21. One very helpful feature of the “Environment” section is the ability to review datasets (R calls them data-frames) after they have been loaded in R. After clicking on a data-frame, the table will open up in the top left window.
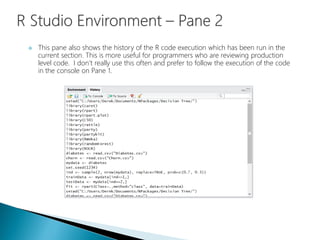
- 22. This pane also shows the history of the R code execution which has been run in the current section. This is more useful for programmers who are reviewing production level code. I don’t really use this often and prefer to follow the execution of the code in the console on Pane 1.
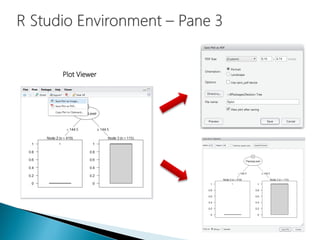
- 23. The pane at the bottom right hand side of the R Management Studio contains a lot of useful features. Files – Allows a review of exported files and ease of access to the working directory. Package Viewer – Allows for a review of all available downloaded packages and easy activation of packages. Plot Viewer – This section contains any plots that have been generated in the R session. Help – This contains a menu for specific questions related to base R or any of the installed packages.
- 24. The Package Viewer Activated Packages
- 25. Plot Viewer
- 26. Help Menu
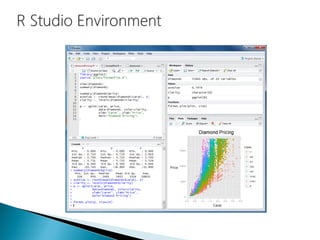
- 27. This is the main section of working within R Studio and R as a whole. All of our work will be constructed here and R Studio has designed the interface to be as user friendly as possible. This section allows for us to develop the R code freely without executing the code sequentially as in the R console.
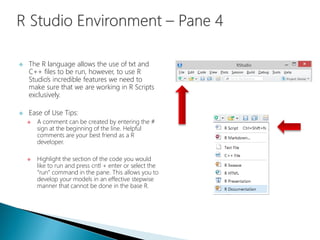
- 28. The R language allows the use of txt and C++ files to be run, however, to use R Studio’s incredible features we need to make sure that we are working in R Scripts exclusively. Ease of Use Tips: A comment can be created by entering the # sign at the beginning of the line. Helpful comments are your best friend as a R developer. Highlight the section of the code you would like to run and press cntl + enter or select the “run” command in the pane. This allows you to develop your models in an effective stepwise manner that cannot be done in the base R.
- 29. There are many different ways that the R language can be used to perform statistical calculations, deploying machine learning algorithms, and manipulating data. The learning curve for mastering the R language is fairly substantial and can be rather daunting for inexperienced programmers. Rather than going through all of the mechanics and nuances of the language, I will focus on the practical application of R scripts and give an overview designed to get you up and running quickly. There will be a number of questions that you will come up with and I would recommend drawing from your googling skills, seek out the R community, and fork some code that’s tailored to your problem.
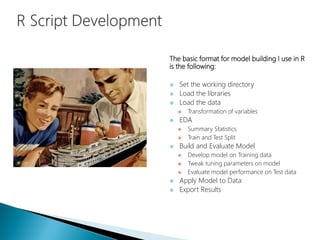
- 30. The basic format for model building I use in R is the following: Set the working directory Load the libraries Load the data Transformation of variables EDA Summary Statistics Train and Test Split Build and Evaluate Model Develop model on Training data Tweak tuning parameters on model Evaluate model performance on Test data Apply Model to Data Export Results
- 31. We should create a folder that contains the R model, import dataset (if applicable), and export the result dataset into this folder. This will keep our projects nice and organized and allow for easy retrieval of our code. This code sets the working directory:
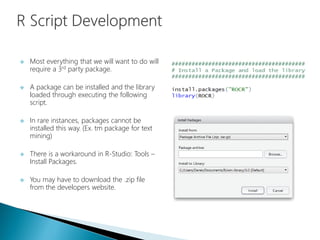
- 32. Most everything that we will want to do will require a 3rd party package. A package can be installed and the library loaded through executing the following script. In rare instances, packages cannot be installed this way. (Ex. tm package for text mining) There is a workaround in R-Studio: Tools – Install Packages. You may have to download the .zip file from the developers website.
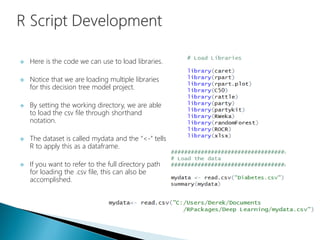
- 33. Here is the code we can use to load libraries. Notice that we are loading multiple libraries for this decision tree model project. By setting the working directory, we are able to load the csv file through shorthand notation. The dataset is called mydata and the “<-” tells R to apply this as a dataframe. If you want to refer to the full directory path for loading the .csv file, this can also be accomplished.
- 34. Data can also be imported/exported from a variety sources instead of a .csv (ODBC, HTML, XML, HDFS, .txt, .xlsx, etc…)
- 35. Once we have the data loaded in R, we can begin to transform the variables. This is where we would address data transformations, changing variable types, removing variables, dummy coding, etc… In our example, we mathematically applied a log transformation to the Pedigree variable and created a new variable called “logPedigree”. Then we will delete the variables Pedigree and BloodPressure from the dataset. Also, the Class variable has been changed from a numeric integer data type into a factor data type.
- 36. The EDA section is devoted to assessing the variables for the model building and will discussed at length in the other tutorials. An important aspect of model building in R is the splitting of the data into a training and test dataset. The seed (1234) is important and allows for us to recreate the results exactly as R produced them. Use seeds before random data splitting. The mechanics and intricacies of the R language for manipulating data can be seen here when creating the data split.
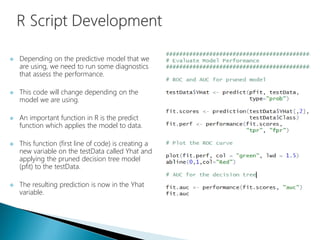
- 37. Depending on the predictive model that we are using, we need to run some diagnostics that assess the performance. This code will change depending on the model we are using. An important function in R is the predict function which applies the model to data. This function (first line of code) is creating a new variable on the testData called Yhat and applying the pruned decision tree model (pfit) to the testData. The resulting prediction is now in the Yhat variable.
- 38. The final dataset (testData) now contains the predictive analytics results. We will now export these results from the R program into a file that can be used in other software interfaces. (Ex. MS SQL Server, Oracle, Tableau, MS Excel, etc…)
- 39. We should create an R Script that contains snippets of R code that you have used for various applications and models. This recipe book will be extremely helpful when you need to perform a specific task and cannot remember exactly how to write the code. With the rich variety of notation available from 3rd party developers, this will make the difference between being a good data scientist and a great one.
- 40. With so many different packages available it is hard to find an exhaustive list. Here are some packages which I utilize on a regular basis.
- 41. R allows for the use of parallel processing. This is particularly useful because of the manner in which models are processed in- memory. If you have complex models that are having trouble being processed in a timely manner or want to take advantage of your Big Data / Hadoop HDFS system, the “parallel” package is certainly worth taking a look at.
- 42. This tutorial is only intended on showing some of the functionality of the R language through example. Please seek out the numerous tutorials available on the internet to build up your skills. Don’t worry if you are struggling with getting your models to process at first; the language is difficult. However, the payoff for learning the R language is great and opens up the full spectrum of statistical methods, web scrapping, big data, and machine learning. Some of the techniques are at the cutting edge of human knowledge and unavailable in SAS / SPSS software platforms. Good luck and welcome to R!!!
- 43. Reside in Wayne, Illinois Active Semi-Professional Classical Musician (Bassoon). Married my wife on 10/10/10 and been together for 10 years. Pet Yorkshire Terrier / Toy Poodle named Brunzie. Pet Maine Coons’ named Maximus Power and Nemesis Gul du Cat. Enjoy Cooking, Hiking, Cycling, Kayaking, and Astronomy. Self proclaimed Data Nerd and Technology Lover.