


Day 1 (Lecture 2): Business Analytics
- 1. Business Analytics: A Complete Overview of Data Driven Decision Making in a Quickly Changing Business Speaker: Isaac Aidoo, Customer Analytics Manager (Customer Experience)
- 2. ● BA Mathematics & Statistics (University of Ghana) ● Head of Quantitative Research (MSR) - 1yr ● Retail Analyst & Advanced Analytics Lead (Nielsen)- 1.7yrs ● Business & Competitive Understanding Analyst (Tigo) - 11months ● Customer Analytics Manager(Tigo) - 1.3yrs ● Churn Manager(Tigo) - 9 months ● Manager, Data Services(Viotech) - 1.6yrs ● Manager, Customer Analytics(Consumer Experience) - 1 yr PROFILE: ISAAC AIDOO
- 3. Focus areas 1. How companies are evolving - 10mins a. Data b. Personnel c. Problems 2. Data Analytics Framework - 10 Mins a. Big data definition b. Data analytics types and trends c. Data analytics framework 3. Case studies from Telco’s & Sponsored Data a. Customer segmentation in Telcos - 20 mins b. Churn prediction - 15 mins 4. Questions - 5 mins
- 4. How companies are evolving ● 2012 - Local Spirits Company Story Previously: Even in large organizations: 1. Traditional research was king 2. Excel was key 3. Schools were teaching traditional commercial tools like SPSS for analysis 4. Typical size of data was not more than 65,536 rows over a 256 column excel sheet
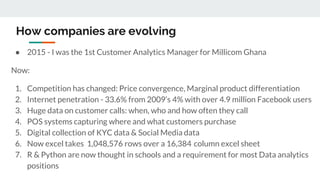
- 5. How companies are evolving ● 2015 - I was the 1st Customer Analytics Manager for Millicom Ghana Now: 1. Competition has changed: Price convergence, Marginal product differentiation 2. Internet penetration - 33.6% from 2009’s 4% with over 4.9 million Facebook users 3. Huge data on customer calls: when, who and how often they call 4. POS systems capturing where and what customers purchase 5. Digital collection of KYC data & Social Media data 6. Now excel takes 1,048,576 rows over a 16,384 column excel sheet 7. R & Python are now thought in schools and a requirement for most Data analytics positions
- 6. What we need now 1. C-Suite & Top Executive champions 2. Training 3. Networking 4. Experimenting 5. Showing business uplift
- 8. Big Data: The elephant & the blind men
- 9. Definition Business analytics (BA) refers to the skills, technologies, practices for continuous iterative exploration and investigation of past business performance to gain insight and drive business planning Beller, Michael J.; Alan Barnett (2009- 06-18). "Next Generation Business Analytics" SKILLS TECHNOLOGIES DATA ITERATIVE PERFORMANCE
- 10. Levels of Analytics: Describe, Predict, Prescribe Heroics ● Spreadsheets ● Extracts Foundational ● Master Data Management ● Data Warehouses ● Data Governance Competitive ● View Consolidated reports ● Dashboards Differentiating ● Micro Segmentation ● Pattern Recognition Break-away ● Mathematical optimization ● Reinforced learning Descriptives Customer 360 View Predictive (Predict the behaviour) Prescriptive Prescribe the optimized action Source: Analytics at work, Davenport et al Analytics Maturity Business Impact
- 11. Business intelligence vrs Business Analytics Source: Wireless Federation: Big Data Report
- 12. Moving from “Selling what we can” to “What they need” Who am I? What do I need? When do I buy? Where do I buy? Demographics Purchases Community/Network Interactions Preferences Intention to purchase Purchase drivers Purchase Triggers Purchase Afinity Activity Based Life event based Shopping Trip Type Channels/Devices Locations Occasions Who should I offer? What should I offer? When should I offer How should I offer Micro-Segmentation and Personalization Offer Allocation based on Goal and Constraints Offer timing Channel selection CUSTOMER NEEDS ENTERPRISE OBJECTIVES Allocate Optimized offer
- 13. Business stakeholders Product Managers Customer Value Management team ( Customer Retention, ARPU Management) Sales & Acquisition Data Warehouse
- 14. CASE STUDIES
- 15. CRISP-DM: Cross industry standard process It provides a structured approach to planning and executing a data mining/analytics project We will use this to guide us through our case studies
- 16. Telco Case studies 1 Customer Segmentation for product development
- 17. Application areas in Telcos 1. Churn & Retention management 2. Product Development & Increase ARPU 3. Customer Acquisition 4. Customer Experience 5. Counter Fraud
- 18. Customer Segmentation Business Problem: (Business objectives, Project Plan, Business success criteria) What are the customer product usage segments we have and does our current product offering meet their needs. How can we develop the identified segments to improve ARPU and customer retention Business stakeholders: CVM and Product team, Marketing Team, DWH team
- 19. Data Understanding ● Data on 3.9mil customers ● Data on Reload patterns, Products usage patterns (frequency & amount), Community of Incoming and Outgoing Calls, Active and Inactive days: A total of 43 variables ● Conducted initial descriptive analysis of all the different variables for the 3.9mil ● Took a sample of 100k for the model largely because of resource capacity
- 20. Data Preparation ● Majority of the behavioural data had considerably skewed distribution so did some transformation of the data ● Took care of correlation in the data by conducting some principal component analysis
- 21. Modeling ● In order to identify an optimal number of clusters to be found by the k– means algorithm, several smaller random samples were first taken from the training dataset and passed through the hierarchical cluster analysis based on the Euclidean distance and using the Ward’s method for agglomeration. ● This preliminary analysis showed initially that k=3 will give a more stable solution (I however readjusted this to 5 after playing around with the k and finding out that the 5 segments made business sense as well) ● I then implemented k-means with which gave the 5 segments
- 22. VISUAL REP of 2 of the Segments
- 23. Actions & Deployment 1. We commissioned a qualitative research to understand the psychographics of these customers better and the reasons behind their behaviour 2. The CVM team cleaned up all products and created new products based on these segments 3. Liased with the DWH team to develop ways to implement this on the larger customer base but this couldn’t materialize before I left the role largely because we did not also have a CRM tool in place 4. This was later implemented in other African countries that Tigo was operational
- 24. Telco Case Study 2 Customer Churn prediction
- 25. Customer Churn prediction Business Problem: The network was facing significant churn in customers and wanted to identify: 1. Profile of customers who have churned 2. Based on that who is likely to churn 3. Identify if there are different segments within churners 4. Propose a product to win back churners Business stakeholders: CVM and Product team, DWH team
- 26. Business Understanding ( Recall & Precision) ● Precision = How many of your positive predictions are actually correct Precision = True Positive / (True Positive + False Positive) : When the cost of predicting that someone will churn is high then you might want a better precision ● Recall = How many of the positive cases did you get correct. Recall = True Positive / ( True Positive + False Negative) : When the cost of predicting that someone will not churn is high ● Without modeling because of the hugely imbalance nature of the data (4% of customers were churners) not building a model but randomly picking customers would have yielded 96% accuracy. So we had to look at different metrics
- 27. Business Understanding ● After engaging stakeholders, business wanted a higher recall measure for HVC customers because of the cost associated with (False Negatives) - When the model predicts that customer will not churn but actually churns; For other segments MVC/LVC we agreed on higher precision as company wasn’t ready to give freebies enmass to customers who don’t give much and
- 28. Data Understanding ● Data on 179k churners over 4.5mil customers ● Data on Reload patterns, Products usage patterns (frequency & amount, time of call, duration), VAS, Community of Incoming and Outgoing Calls, Active and Inactive days, 59 variables ● Hold out recent two months data as test set
- 29. Data Preparation ● Most customers do not suddenly stop using the service we had to break transactional data into periods and create customer cadence metrics for most of the transactions data ● Majority of the behavioural data had considerably skewed distribution so did some transformation of the data ● Preliminary feature importance
- 30. Modeling ● Different models were built for HVC customers and (MVC & LVC customers) ● C5.0 Decision tree model was used, initially to understand the path of the churner ● Logistic regression, SVM, Adaboost were the models implemented ● SVM gave the highest precision on the test set at 89% but recall of 68% ● C5.0 gave a recall of 89% and Precision of 70% ● We also realized that the community of customers was a major factor in predicting churn
- 31. Actions & Deployment 1. Created a new product where one onnet contact of customers who had high likelihood of churning were given free airtime to call and activate the churner 2. Created a churn and customer retention framework with relevant product offerings
- 32. QUESTIONS