Debugging and Profiling Symfony Apps
- 1. Debugging and Profiling symfony applications by Alvaro Videla Wednesday, February 17, 2010
- 2. About Me • Lead Developer at TheNetCircle.com • Creator of FireSymfony • Twitter: @old_sound • Blog: http://obvioushints.blogspot.com/ Wednesday, February 17, 2010
- 3. About Me • Lead Developer at TheNetCircle.com • Creator of FireSymfony - 16.000 downloads • Twitter: @old_sound • Blog: http://obvioushints.blogspot.com/ Wednesday, February 17, 2010
- 4. About our symfony site • 2.000.000+ members • 250.000+ logins/day • 300.000+ private messages/day • 14.000 req/min in the top 6 actions Wednesday, February 17, 2010
- 5. Let’s talk about: • Debugging Tools • Profiling Tools • Benchmarking Tools • Live Site Metrics Wednesday, February 17, 2010
- 6. Symfony Tools Wednesday, February 17, 2010
- 7. Loggers Wednesday, February 17, 2010
- 8. sfFileLogger • logs per controller & environment • very useful for development • Prod, disable or set level: err Wednesday, February 17, 2010
- 9. There’s a lot of information on the logs • Cache hits • Cache misses • Number of Database Queries Wednesday, February 17, 2010
- 10. AWK • Extract information using AWK • use: /(M|m)atch route/ http://gist.github.com/271034 Wednesday, February 17, 2010
- 11. Problems of this approach • Hard to use with several servers • Require to ssh and inspect logs in each of the servers • Hard to visualize data in context Wednesday, February 17, 2010
- 12. Next Step A Centralized Logger Wednesday, February 17, 2010
- 13. Sample Use Case • CouchDB backend • One Server collecting logs from 28 PHP machines • 15 million logs in the first week Wednesday, February 17, 2010
- 14. A Centralized Logger Wednesday, February 17, 2010
- 15. 5 minute How To A Redis Logger http://github.com/videlalvaro/avRedisLoggerPlugin Wednesday, February 17, 2010
- 16. Logger Roadmap Wednesday, February 17, 2010
- 17. Timers Wednesday, February 17, 2010
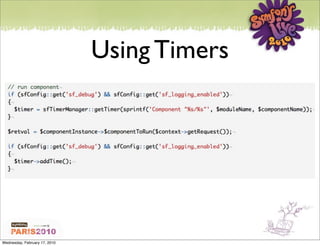
- 18. sfTimer • Easy to use • Integrated with symfony debug tools Wednesday, February 17, 2010
- 19. Using Timers Wednesday, February 17, 2010
- 20. Problems of this approach • Require to modify the code to add timers • Only provides execution time information • Best suited to run in dev mode Wednesday, February 17, 2010
- 21. Next Step Profile with XHProf Wednesday, February 17, 2010
- 22. XHProf • C extension for PHP • Open sourced by Facebook • Hierarchical Profiler • Extracts: - Walltime - Memory Usage Wednesday, February 17, 2010
- 23. XHProf Web Interface • Single Runs • Compare Runs • Aggregate Runs • Sort runs by: - Number Function Calls - Memory Usage - Walltime Wednesday, February 17, 2010
- 24. 5 minute How To Adding XHProf to an index.php http://gist.github.com/300261 Wednesday, February 17, 2010
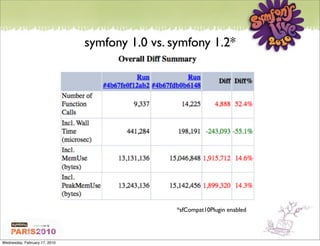
- 25. symfony 1.0 vs. symfony 1.2* *sfCompat10Plugin enabled Wednesday, February 17, 2010
- 26. @old_sound: “Hello World!” Benchmarks Considered Evil! #sflive2010 1 second ago from Cité Universitaire Internationale Wednesday, February 17, 2010
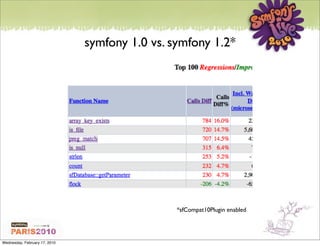
- 27. symfony 1.0 vs. symfony 1.2* *sfCompat10Plugin enabled Wednesday, February 17, 2010
- 28. symfony 1.0 vs. symfony 1.2* *sfCompat10Plugin enabled Wednesday, February 17, 2010
- 29. Tsung • High performance benchmarking framework • Open Source • Distributed benchmarking • Can simulate user sessions • Records and replay browser interaction • Can benchmark HTTP, MySQL, Ejabberd • Can be extended Wednesday, February 17, 2010
- 30. Tsung Sessions • Arrival Phase • Duration • Amount of Users • Meassure system load Wednesday, February 17, 2010
- 31. Tsung Wednesday, February 17, 2010
- 32. Metrics Wednesday, February 17, 2010
- 33. Metrics Live Site Metrics With Graphite Wednesday, February 17, 2010
- 34. Graphite • “... a highly scalable real-time graphing system” • Open Source • Text Protocol • Awesome Graphics Capabilities http://graphite.wikidot.com/ Wednesday, February 17, 2010
- 35. Graphite in Action Wednesday, February 17, 2010
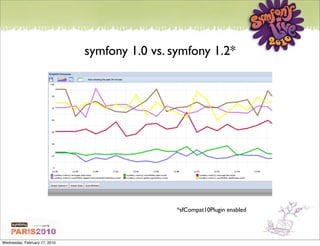
- 36. We use it for • System Load Comparisons • APC Stats • Memcache Stats • Number of Online Users • AVG module/action request time • AVG module/action memory usage • module/action request count Wednesday, February 17, 2010
- 37. symfony 1.0 vs. symfony 1.2* *sfCompat10Plugin enabled Wednesday, February 17, 2010
- 38. symfony 1.0 vs. symfony 1.2* *sfCompat10Plugin enabled Wednesday, February 17, 2010
- 39. 5 minute How To Adding Graphite to an index.php http://gist.github.com/300265 Wednesday, February 17, 2010
- 40. Roadmap • Write C PHP Extension • Take advantage of Request Life Cycle • Ease metric recording Wednesday, February 17, 2010
- 41. Links • http://www.rabbitmq.com/ • http://tsung.erlang-projects.org/ • http://graphite.wikidot.com/ • http://pecl.php.net/package/xhprof Wednesday, February 17, 2010
- 42. Questions? Wednesday, February 17, 2010
- 43. Thanks! Alvaro Videla http://twitter.com/old_sound Wednesday, February 17, 2010


