Location via proxy:   [ UP ]  
[Report a bug]   [Manage cookies]                
SlideShare a Scribd company logo
Decision Tree


   R. Akerkar
   TMRF, Kolhapur, India


                      R. Akerkar   1
Introduction

   A classification scheme which generates a tree and
                                    g
    a set of rules from given data set.

   The t f
    Th set of records available f d
                    d       il bl for developing
                                          l i
    classification methods is divided into two disjoint
    subsets – a training set and a test set.
                        g
   The attributes of the records are categorise into two
    types:
       Attributes hose
        Attrib tes whose domain is n merical are called n merical
                                   numerical            numerical
        attributes.
       Attributes whose domain is not numerical are called the
        categorical attributes
                    attributes.

                               R. Akerkar                           2
Introduction

   A decision tree is a tree with the following p p
                                               g properties:
     An inner node represents an attribute.

     An edge represents a test on the attribute of the father
      node.
      node
     A leaf represents one of the classes.


   Construction of a decision tree
     Based on the training data

     Top Down strategy
      Top-Down


                             R. Akerkar                      3
Decision Tree
Example


   The data set has five attributes.
   There is a special attribute: the attribute class is the class label.
   The attributes, temp (temperature) and humidity are numerical
    attributes
   Other attributes are categorical, that is, they cannot be ordered.

   Based on the training data set, we want to find a set of rules to
    know what values of outlook, temperature, humidity and wind,
    determine whether or not to play golf.

                                  R. Akerkar                                4
Decision Tree
    Example


    We have five leaf nodes.
    In a decision tree, each leaf node represents a rule.

    We have the following rules corresponding to the tree given in
     Figure.

    RULE 1      If it is sunny and the humidity is not above 75% then play
                                                              75%,      play.
    RULE 2      If it is sunny and the humidity is above 75%, then do not play.
    RULE 3      If it is overcast, then play.
    RULE 4      If it is rainy and not windy, then play.
    RULE 5      If it is rainy and windy, then don't play.
                       i    i     d i d th d 't l

                                     R. Akerkar                                    5
Classification

   The classification of an unknown input vector is done by
                                          p                   y
    traversing the tree from the root node to a leaf node.
   A record enters the tree at the root node.
   At the root, a test is applied to determine which child
           root
    node the record will encounter next.
   This process is repeated until the record arrives at a leaf
    node.
       d
   All the records that end up at a given leaf of the tree are
    classified in the same way. y
   There is a unique path from the root to each leaf.
   The path is a rule which is used to classify the records.


                              R. Akerkar                          6
   In our tree, we can carry out the classification
    for a u
     o an unknown record as follows.
                 o   eco d        o o s
   Let us assume, for the record, that we know
    the values of the first four attributes (but we
    do not know the value of class attribute) as

   outlook= rain; temp = 70; humidity = 65; and
    windy true.
    windy= true
                         R. Akerkar                7
   We start from the root node to check the value of the attribute
    associated at the root node.
   This attribute is the splitting attribute at this node.
   For a decision tree, at every node there is an attribute associated
    with the node called the splitting attribute.

   In our example, outlook is the splitting attribute at root.
   Since for the given record, outlook = rain, we move to the right-
    most child node of the root.
   At this node, the splitting attribute is windy and we find that for
    the record we want classify, windy = true.
   Hence, we move to the left child node to conclude that the class
    label Is "no l "
    l b l I " play".


                                 R. Akerkar                               8
   The accuracy of the classifier is determined by the percentage of the
     test d t
     t t data set that is correctly classified.
                t th t i        tl l     ifi d

    We can see that for Rule 1 there are two records of the test data set
     satisfying outlook= sunny and humidity < 75, and only one of these
     is correctly classified as play.
    Thus, the accuracy of this rule is 0.5 (or 50%). Similarly, the
     accuracy of Rule 2 is also 0.5 (or 50%). The accuracy of Rule 3 is
     0.66.


RULE 1
If it is sunny and the humidity
is not above 75%, then play.


                                   R. Akerkar                                9
Concept of Categorical Attributes

   Consider the following training
    data set.
   There are three attributes,
    namely, age, pincode and class.
   The attribute class is used for
    class label.

     The attribute age is a numeric attribute, whereas pincode is a categorical
     one.
     Though th d
     Th   h the domain of pincode i numeric, no ordering can b d fi d
                    i f i      d is      i        d i        be defined
     among pincode values.
     You cannot derive any useful information if one pin-code is greater than
     another pincode
             pincode.

                                     R. Akerkar                                   10
   Figure gives a decision tree for the
    training data
             data.

   The splitting attribute at the root is
    pincode and the splitting criterion
    here is pincode = 500 046.
   Similarly, for the left child node, the
    splitting criterion is age < 48 (the
     p      g               g       (
    splitting attribute is age).
                                                  At root level, we have 9 records.
   Although the right child node has             The associated splitting criterion is
                                                                    p    g
    the same attribute as the splitting           pincode = 500 046.
    attribute, the splitting criterion is
    different.                                     As a result, we split the records
                                                  into two subsets. Records 1, 2, 4, 8,
                                                  and 9 are to the left child note and
                                                  remaining to the right node.
                                                  The process is repeated at every
                                                  node.

                                     R. Akerkar                                           11
Advantages and Shortcomings of Decision
Tree Classifications
   A decision tree construction process is concerned with identifying
    the splitting attributes and splitting criterion at every l
     h    li i        ib       d li i        i i              level of the tree.
                                                                  l f h

   Major strengths are:
       Decision tree able to generate understandable rules.
       They are able to handle both numerical and categorical attributes.
       They provide clear indication of which fields are most important for
        prediction or classification
                      classification.

   Weaknesses are:
       The process of growing a decision tree is computationally expensive At
                                                                  expensive.
        each node, each candidate splitting field is examined before its best split
        can be found.
       Some decision tree can only deal with binary-valued target classes.


                                       R. Akerkar                                 12
Iterative Dichotomizer (ID3)
   Quinlan (1986)
   Each node corresponds to a splitting attribute
   Each arc is a possible value of that attribute.

   At each node the splitting attribute is selected to be the most
    informative among the attributes not yet considered in the path from
    the root.

   Entropy is used to measure how informative is a node.
   The algorithm uses the criterion of information gain to determine the
    goodness of a split.
       d        f    lit
       The attribute with the greatest information gain is taken as
        the splitting attribute, and the data set is split for all distinct
        values of the attribute
                       attribute.

                                    R. Akerkar                                13
Training Dataset
                   This follows an example from Quinlan’s ID3

The class label attribute,
buys_computer, has two distinct
values.                              age    income student credit_rating   buys_computer
                                   <=30    high
                                             g        no fair                   no
Thus there are two distinct        <=30    high       no excellent              no
classes. (m =2)                    31…40   high       no fair                   yes
Class C1 corresponds to yes        >40     medium     no fair                   yes
and class C2 corresponds to no
                            no.    >40     low       yes fair                   yes
                                   >40     low       yes excellent              no
There are 9 samples of class yes   31…40   low       yes excellent              yes
and 5 samples of class no.         <=30    medium     no fair                   no
                                   <=30    low       yes fair                   yes
                                   >40
                                    40     medium
                                               di    yes f i
                                                          fair                  yes
                                   <=30    medium    yes excellent              yes
                                   31…40   medium     no excellent              yes
                                   31…40   high      yes fair                   yes
                                   >40     medium     no excellent              no


                                     R. Akerkar                                       14
Extracting Classification Rules from Trees
         g

   Represent the knowledge in
    the form of IF-THEN rules
   One rule is created for each
    path from the root to a leaf
   Each attribute-value pair
    along a path forms a
    conjunction
   The leaf node holds the class
    p
    prediction
                                             What are the rules?
   Rules are easier for humans
    to understand


                                R. Akerkar                     15
Solution (Rules)

 IF age = “<=30” AND student = “no” THEN buys_computer = “no”


 IF age = “<=30” AND student = “yes” THEN buys_computer = “yes”


 IF age = “31…40”           THEN buys_computer = “yes”


 IF age = “>40” AND credit_rating = “excellent” THEN
    buys_computer = “yes”


 IF age = “<=30” AND credit_rating = “fair” THEN buys_computer =
    “no”


                             R. Akerkar                            16
Algorithm for Decision Tree Induction

   Basic algorithm (a greedy algorithm)
     Tree is constructed in a top-down recursive divide-and-conquer
      manner
     At start, all the training examples are at the root

     Attributes are categorical ( continuous-valued, they are
                            g      (if                      y
      discretized in advance)
     Examples are partitioned recursively based on selected attributes

     Test attributes are selected on the basis of a heuristic or
      statistical measure (e.g., information gain)
   Conditions for stopping partitioning
     All samples for a g
               p           given node belong to the same class
                                           g
     There are no remaining attributes for further partitioning –
      majority voting is employed for classifying the leaf
     There are no samples left
                           p

                                 R. Akerkar                          17
Attribute Selection Measure: Information
Gain (ID3/C4.5)
      (ID3/C4 5)

   Select the attribute with the highest information gain
   S contains si tuples of class Ci for i = {1, …, m}
   information measures info required to classify any
                                               q                y y
    arbitrary tuple                          m
                                                 si  si
                    I( s1,s 2,...,s m )    log 2

                                            i 1 s   s ….information is encoded in bits.
   entropy of attribute A with values {a1,a2,…,av}
               f    b                   h l         {
                                  v
                                      s1 j  ... smj
                          E(A)                      I ( s1 j ,...,smj )
                                 j 1         s

   information gained by branching on attribute A

                       Gain(A)  I(s 1, s 2 ,..., sm)  E(A)
                                         R. Akerkar                                  18
Entropy
   Entropy measures the homogeneity (purity) of a set of examples.
   It gives the information content of the set in terms of the class labels of
    the examples.
   Consider that you have a set of examples, S with two classes, P and N. Let
    the set have p instances for the class P and n instances for the class N.
   So the total number of instances we have is t = p + n. The view [p, n] can
    be seen as a class distribution of S.

The entropy for S is defined as
    Entropy(S) = - (p/t).log2(p/t) - (n/t).log2(n/t)

   Example: Let a set of examples consists of 9 instances for class positive,
    and 5 instances for class negative.
   Answer: p = 9 and n = 5.
   So Entropy(S) = - (9/14).log2(9/14) - (5/14).log2(5/14)
                 = -(0.64286)(-0.6375) - (0.35714)(-1.48557)
                 = (0.40982) + (0.53056)
                 = 0.940


                                        R. Akerkar                               19
Entropy
      y
The entropy for a completely pure set is 0 and is 1 for a set with
  equal occurrences f both th classes.
        l            for b th the l

i.e. Entropy[14,0] = - (14/14).log2(14/14) - (0/14).log2(0/14)
                    = -1.log2(1) - 0 l 2(0)
                       1 l 2(1) 0.log2(0)
                    = -1.0 - 0
                    =0

i.e. Entropy[7,7] = - (7/14).log2(7/14) - (7/14).log2(7/14)
                   = - (0.5).log2(0.5) - (0.5).log2(0.5)
                   = - (0.5).(-1) - (0.5).(-1)
                   = 0.5 + 0.5
                   =1


                                   R. Akerkar                        20
Attribute Selection by Information Gain
         Computation
                                                                          5              4
    Class P: buys_computer = “yes”                          E ( age )     I ( 2 ,3)     I ( 4,0 )
                                                                         14             14
    Class N: buys_computer = “no”
                                                                          5
    I(p, n) = I(9, 5) =0.940                                              I (3, 2 )  0 .694
    Compute the entropy for age:
                                                                         14
        age         pi      ni I(pi, ni)              5
       <=30         2       3 0.971                     I ( 2,3) means ““age <=30” h 5
                                                                                30” has
                                                     14
       30…40        4       0 0                             out of 14 samples, with 2 yes's
       >40
        40          3       2 0.971                           and 3 no’s. Hence
                                                                    no s.
  age    income student credit_rating   buys_computer
<=30
<=30
        high
        high
                   no
                   no
                       fair
                       excellent
                                             no
                                             no
                                                       Gain ( age )  I ( p , n )  E ( age )  0.246
31…40   high       no  fair                  yes
>40
>40
        medium
        low
                   no
                  yes
                       fair
                       fair
                                             yes
                                             yes
                                                         Similarly Gain(income)  0.029
                                                         Similarly,
>40     low       yes  excellent             no                          Gain( student )  0.151
31…40   low       yes  excellent             yes
<=30    medium     no  fair                  no                          Gain(credit _ rating )  0.048
<=30    low       yes  fair                  yes
>40     medium    yes  fair                  yes
<=30    medium    yes  excellent             yes             Since, age has the highest information gain
31…40   medium     no  excellent             yes             among the attributes, it is selected as the
31…40   high      yes  fair                  yes
>40     medium     no  excellent             no R. Akerkar
                                                             test attribute.                          21
Exercise 1
   The following table consists of training data from an employee
    database.
    database


   Let status be the class attribute. Use the ID3 algorithm to construct a
    decision tree from the given data.


                                   R. Akerkar                            22
Solution 1


             R. Akerkar   23
Other Attribute Selection Measures

   Gini index (CART IBM IntelligentMiner)
               (CART,
       All attributes are assumed continuous-valued
       Assume there exist several possible split values for each
        attribute
       May need other tools, such as clustering, to get the
        possible split values
       Can be modified for categorical attributes


                                R. Akerkar                          24
Gini Index (IBM IntelligentMiner)
   If a data set T contains examples from n classes, gini index, gini(T) is
                                          n
    defined as            gini (T )  1   p 2
                           i i                      j
                                          j 1
    where pj is the relative frequency of class j in T.
   If a data set T is split into two subsets T1 and T2 with sizes N1 and N2
    respectively, the gini index of the split data contains examples from n
    classes, the gini index gini(T) is defined as


               gini   split
                              (T )  N 1 gini (T 1)  N 2 gini (T 2 )
                                     N                N
   The attribute provides the smallest ginisplit(T) is chosen to split the node
    (need to enumerate all possible splitting points for each attribute).


                                       R. Akerkar                              25
Exercise 2


             R. Akerkar   26
Solution 2
   SPLIT: Age <= 50
              ----------------------
            | High | Low | Total
               --------------------
   S1 (left) | 8 | 11 | 19
   S2 (right) | 11 | 10 | 21
              --------------------
   For S1: P(high) = 8/19 = 0.42 and P(low) = 11/19 = 0.58
   For S2: P(high) = 11/21 = 0.52 and P(low) = 10/21 = 0.48
   Gini(S1) = 1-[0.42x0.42 + 0.58x0.58] = 1-[0.18+0.34] = 1-0.52 = 0.48
   Gini(S2) = 1-[0.52x0.52 + 0.48x0.48] = 1-[0.27+0.23] = 1-0.5 = 0.5
   Gini-Split(Age<=50) = 19/40 x 0.48 + 21/40 x 0.5 = 0.23 + 0.26 = 0.49

   SPLIT: Salary <= 65K
                      <
                  ----------------------
                 | High | Low | Total
                   --------------------
   S1 (top)     | 18 | 5 | 23
   S2 (bottom) | 1 | 16 | 17
                    --------------------
   For S1: P(high) = 18/23 = 0.78 and P(low) = 5/23 = 0.22
   For S2: P(high) = 1/17 = 0.06 and P(low) = 16/17 = 0.94
   Gini(S1) = 1-[0.78x0.78 + 0.22x0.22] = 1-[0.61+0.05] = 1-0.66 = 0.34
   Gini(S2) = 1-[0.06x0.06 + 0 94x0 94] = 1-[0 004+0 884] = 1-0 89 = 0 11
                1-[0 06x0 06 0.94x0.94] 1-[0.004+0.884] 1-0.89 0.11
   Gini-Split(Age<=50) = 23/40 x 0.34 + 17/40 x 0.11 = 0.20 + 0.05 = 0.25


                                                 R. Akerkar                  27
Exercise 3

   In previous exercise which is a better split of
                exercise,
    the data among the two split points? Why?


                        R. Akerkar                    28
Solution 3
   Intuitively Salary <= 65K is a better split point since it produces
    relatively ``pure'' partitions as opposed to Age <= 50 which
                 pure''                                   50,
    results in more mixed partitions (i.e., just look at the distribution
    of Highs and Lows in S1 and S2).

   More formally, let us consider the properties of the Gini index.
    If a partition is totally pure, i.e., has all elements from the same
    class, then gini(S) = 1-[1x1+0x0] = 1-1 = 0 (for two classes).

    On the other hand if the classes are totally mixed, i.e., both
    classes have equal probability then
    gini(S) = 1 - [0 5x0 5 + 0 5x0 5] = 1 [0 25+0 25] = 0 5
                  [0.5x0.5 0.5x0.5] 1-[0.25+0.25] 0.5.

    In other words the closer the gini value is to 0, the better the
    partition is. Since Salary has lower gini it is a better split.
              is                                             split

                                   R. Akerkar                               29
Avoid Overfitting in Classification
 vo d v         g C ss c o
   Overfitting: An induced tree may overfit the training data
     Too many branches, some may reflect anomalies due to noise
      or outliers
     Poor accuracy for unseen samples
                     y                p
   Two approaches to avoid overfitting
     Prepruning: Halt tree construction early—do not split a node if
      this would result in the goodness measure falling below a
      threshold
       Difficult to choose an appropriate threshold

     Postpruning: Remove branches from a “fully grown” tree—get a
      sequence of progressively pruned t
                   f          i l       d trees
       Use a set of data different from the training data to decide
          which is the “best pruned tree”


                                R. Akerkar                          30

More Related Content

Decision tree

  • 1. Decision Tree R. Akerkar TMRF, Kolhapur, India R. Akerkar 1
  • 2. Introduction  A classification scheme which generates a tree and g a set of rules from given data set.  The t f Th set of records available f d d il bl for developing l i classification methods is divided into two disjoint subsets – a training set and a test set. g  The attributes of the records are categorise into two types:  Attributes hose Attrib tes whose domain is n merical are called n merical numerical numerical attributes.  Attributes whose domain is not numerical are called the categorical attributes attributes. R. Akerkar 2
  • 3. Introduction  A decision tree is a tree with the following p p g properties:  An inner node represents an attribute.  An edge represents a test on the attribute of the father node. node  A leaf represents one of the classes.  Construction of a decision tree  Based on the training data  Top Down strategy Top-Down R. Akerkar 3
  • 4. Decision Tree Example  The data set has five attributes.  There is a special attribute: the attribute class is the class label.  The attributes, temp (temperature) and humidity are numerical attributes  Other attributes are categorical, that is, they cannot be ordered.  Based on the training data set, we want to find a set of rules to know what values of outlook, temperature, humidity and wind, determine whether or not to play golf. R. Akerkar 4
  • 5. Decision Tree Example  We have five leaf nodes.  In a decision tree, each leaf node represents a rule.  We have the following rules corresponding to the tree given in Figure.  RULE 1 If it is sunny and the humidity is not above 75% then play 75%, play.  RULE 2 If it is sunny and the humidity is above 75%, then do not play.  RULE 3 If it is overcast, then play.  RULE 4 If it is rainy and not windy, then play.  RULE 5 If it is rainy and windy, then don't play. i i d i d th d 't l R. Akerkar 5
  • 6. Classification  The classification of an unknown input vector is done by p y traversing the tree from the root node to a leaf node.  A record enters the tree at the root node.  At the root, a test is applied to determine which child root node the record will encounter next.  This process is repeated until the record arrives at a leaf node. d  All the records that end up at a given leaf of the tree are classified in the same way. y  There is a unique path from the root to each leaf.  The path is a rule which is used to classify the records. R. Akerkar 6
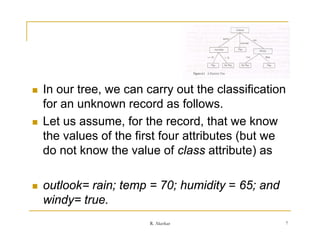
  • 7. In our tree, we can carry out the classification for a u o an unknown record as follows. o eco d o o s  Let us assume, for the record, that we know the values of the first four attributes (but we do not know the value of class attribute) as  outlook= rain; temp = 70; humidity = 65; and windy true. windy= true R. Akerkar 7
  • 8. We start from the root node to check the value of the attribute associated at the root node.  This attribute is the splitting attribute at this node.  For a decision tree, at every node there is an attribute associated with the node called the splitting attribute.  In our example, outlook is the splitting attribute at root.  Since for the given record, outlook = rain, we move to the right- most child node of the root.  At this node, the splitting attribute is windy and we find that for the record we want classify, windy = true.  Hence, we move to the left child node to conclude that the class label Is "no l " l b l I " play". R. Akerkar 8
  • 9. The accuracy of the classifier is determined by the percentage of the test d t t t data set that is correctly classified. t th t i tl l ifi d  We can see that for Rule 1 there are two records of the test data set satisfying outlook= sunny and humidity < 75, and only one of these is correctly classified as play.  Thus, the accuracy of this rule is 0.5 (or 50%). Similarly, the accuracy of Rule 2 is also 0.5 (or 50%). The accuracy of Rule 3 is 0.66. RULE 1 If it is sunny and the humidity is not above 75%, then play. R. Akerkar 9
  • 10. Concept of Categorical Attributes  Consider the following training data set.  There are three attributes, namely, age, pincode and class.  The attribute class is used for class label. The attribute age is a numeric attribute, whereas pincode is a categorical one. Though th d Th h the domain of pincode i numeric, no ordering can b d fi d i f i d is i d i be defined among pincode values. You cannot derive any useful information if one pin-code is greater than another pincode pincode. R. Akerkar 10
  • 11. Figure gives a decision tree for the training data data.  The splitting attribute at the root is pincode and the splitting criterion here is pincode = 500 046.  Similarly, for the left child node, the splitting criterion is age < 48 (the p g g ( splitting attribute is age). At root level, we have 9 records.  Although the right child node has The associated splitting criterion is p g the same attribute as the splitting pincode = 500 046. attribute, the splitting criterion is different. As a result, we split the records into two subsets. Records 1, 2, 4, 8, and 9 are to the left child note and remaining to the right node. The process is repeated at every node. R. Akerkar 11
  • 12. Advantages and Shortcomings of Decision Tree Classifications  A decision tree construction process is concerned with identifying the splitting attributes and splitting criterion at every l h li i ib d li i i i level of the tree. l f h  Major strengths are:  Decision tree able to generate understandable rules.  They are able to handle both numerical and categorical attributes.  They provide clear indication of which fields are most important for prediction or classification classification.  Weaknesses are:  The process of growing a decision tree is computationally expensive At expensive. each node, each candidate splitting field is examined before its best split can be found.  Some decision tree can only deal with binary-valued target classes. R. Akerkar 12
  • 13. Iterative Dichotomizer (ID3)  Quinlan (1986)  Each node corresponds to a splitting attribute  Each arc is a possible value of that attribute.  At each node the splitting attribute is selected to be the most informative among the attributes not yet considered in the path from the root.  Entropy is used to measure how informative is a node.  The algorithm uses the criterion of information gain to determine the goodness of a split. d f lit  The attribute with the greatest information gain is taken as the splitting attribute, and the data set is split for all distinct values of the attribute attribute. R. Akerkar 13
  • 14. Training Dataset This follows an example from Quinlan’s ID3 The class label attribute, buys_computer, has two distinct values. age income student credit_rating buys_computer <=30 high g no fair no Thus there are two distinct <=30 high no excellent no classes. (m =2) 31…40 high no fair yes Class C1 corresponds to yes >40 medium no fair yes and class C2 corresponds to no no. >40 low yes fair yes >40 low yes excellent no There are 9 samples of class yes 31…40 low yes excellent yes and 5 samples of class no. <=30 medium no fair no <=30 low yes fair yes >40 40 medium di yes f i fair yes <=30 medium yes excellent yes 31…40 medium no excellent yes 31…40 high yes fair yes >40 medium no excellent no R. Akerkar 14
  • 15. Extracting Classification Rules from Trees g  Represent the knowledge in the form of IF-THEN rules  One rule is created for each path from the root to a leaf  Each attribute-value pair along a path forms a conjunction  The leaf node holds the class p prediction What are the rules?  Rules are easier for humans to understand R. Akerkar 15
  • 16. Solution (Rules) IF age = “<=30” AND student = “no” THEN buys_computer = “no” IF age = “<=30” AND student = “yes” THEN buys_computer = “yes” IF age = “31…40” THEN buys_computer = “yes” IF age = “>40” AND credit_rating = “excellent” THEN buys_computer = “yes” IF age = “<=30” AND credit_rating = “fair” THEN buys_computer = “no” R. Akerkar 16
  • 17. Algorithm for Decision Tree Induction  Basic algorithm (a greedy algorithm)  Tree is constructed in a top-down recursive divide-and-conquer manner  At start, all the training examples are at the root  Attributes are categorical ( continuous-valued, they are g (if y discretized in advance)  Examples are partitioned recursively based on selected attributes  Test attributes are selected on the basis of a heuristic or statistical measure (e.g., information gain)  Conditions for stopping partitioning  All samples for a g p given node belong to the same class g  There are no remaining attributes for further partitioning – majority voting is employed for classifying the leaf  There are no samples left p R. Akerkar 17
  • 18. Attribute Selection Measure: Information Gain (ID3/C4.5) (ID3/C4 5)  Select the attribute with the highest information gain  S contains si tuples of class Ci for i = {1, …, m}  information measures info required to classify any q y y arbitrary tuple m si si I( s1,s 2,...,s m )    log 2  i 1 s s ….information is encoded in bits.  entropy of attribute A with values {a1,a2,…,av} f b h l { v s1 j  ... smj E(A)  I ( s1 j ,...,smj ) j 1 s  information gained by branching on attribute A Gain(A)  I(s 1, s 2 ,..., sm)  E(A) R. Akerkar 18
  • 19. Entropy  Entropy measures the homogeneity (purity) of a set of examples.  It gives the information content of the set in terms of the class labels of the examples.  Consider that you have a set of examples, S with two classes, P and N. Let the set have p instances for the class P and n instances for the class N.  So the total number of instances we have is t = p + n. The view [p, n] can be seen as a class distribution of S. The entropy for S is defined as  Entropy(S) = - (p/t).log2(p/t) - (n/t).log2(n/t)  Example: Let a set of examples consists of 9 instances for class positive, and 5 instances for class negative.  Answer: p = 9 and n = 5.  So Entropy(S) = - (9/14).log2(9/14) - (5/14).log2(5/14)  = -(0.64286)(-0.6375) - (0.35714)(-1.48557)  = (0.40982) + (0.53056)  = 0.940 R. Akerkar 19
  • 20. Entropy y The entropy for a completely pure set is 0 and is 1 for a set with equal occurrences f both th classes. l for b th the l i.e. Entropy[14,0] = - (14/14).log2(14/14) - (0/14).log2(0/14) = -1.log2(1) - 0 l 2(0) 1 l 2(1) 0.log2(0) = -1.0 - 0 =0 i.e. Entropy[7,7] = - (7/14).log2(7/14) - (7/14).log2(7/14) = - (0.5).log2(0.5) - (0.5).log2(0.5) = - (0.5).(-1) - (0.5).(-1) = 0.5 + 0.5 =1 R. Akerkar 20
  • 21. Attribute Selection by Information Gain Computation 5 4  Class P: buys_computer = “yes” E ( age )  I ( 2 ,3)  I ( 4,0 ) 14 14  Class N: buys_computer = “no” 5  I(p, n) = I(9, 5) =0.940  I (3, 2 )  0 .694  Compute the entropy for age: 14 age pi ni I(pi, ni) 5 <=30 2 3 0.971 I ( 2,3) means ““age <=30” h 5 30” has 14 30…40 4 0 0 out of 14 samples, with 2 yes's >40 40 3 2 0.971 and 3 no’s. Hence no s. age income student credit_rating buys_computer <=30 <=30 high high no no fair excellent no no Gain ( age )  I ( p , n )  E ( age )  0.246 31…40 high no fair yes >40 >40 medium low no yes fair fair yes yes Similarly Gain(income)  0.029 Similarly, >40 low yes excellent no Gain( student )  0.151 31…40 low yes excellent yes <=30 medium no fair no Gain(credit _ rating )  0.048 <=30 low yes fair yes >40 medium yes fair yes <=30 medium yes excellent yes Since, age has the highest information gain 31…40 medium no excellent yes among the attributes, it is selected as the 31…40 high yes fair yes >40 medium no excellent no R. Akerkar test attribute. 21
  • 22. Exercise 1  The following table consists of training data from an employee database. database  Let status be the class attribute. Use the ID3 algorithm to construct a decision tree from the given data. R. Akerkar 22
  • 23. Solution 1 R. Akerkar 23
  • 24. Other Attribute Selection Measures  Gini index (CART IBM IntelligentMiner) (CART,  All attributes are assumed continuous-valued  Assume there exist several possible split values for each attribute  May need other tools, such as clustering, to get the possible split values  Can be modified for categorical attributes R. Akerkar 24
  • 25. Gini Index (IBM IntelligentMiner)  If a data set T contains examples from n classes, gini index, gini(T) is n defined as gini (T )  1   p 2 i i j j 1 where pj is the relative frequency of class j in T.  If a data set T is split into two subsets T1 and T2 with sizes N1 and N2 respectively, the gini index of the split data contains examples from n classes, the gini index gini(T) is defined as gini split (T )  N 1 gini (T 1)  N 2 gini (T 2 ) N N  The attribute provides the smallest ginisplit(T) is chosen to split the node (need to enumerate all possible splitting points for each attribute). R. Akerkar 25
  • 26. Exercise 2 R. Akerkar 26
  • 27. Solution 2  SPLIT: Age <= 50  ----------------------  | High | Low | Total  --------------------  S1 (left) | 8 | 11 | 19  S2 (right) | 11 | 10 | 21  --------------------  For S1: P(high) = 8/19 = 0.42 and P(low) = 11/19 = 0.58  For S2: P(high) = 11/21 = 0.52 and P(low) = 10/21 = 0.48  Gini(S1) = 1-[0.42x0.42 + 0.58x0.58] = 1-[0.18+0.34] = 1-0.52 = 0.48  Gini(S2) = 1-[0.52x0.52 + 0.48x0.48] = 1-[0.27+0.23] = 1-0.5 = 0.5  Gini-Split(Age<=50) = 19/40 x 0.48 + 21/40 x 0.5 = 0.23 + 0.26 = 0.49  SPLIT: Salary <= 65K <  ----------------------  | High | Low | Total  --------------------  S1 (top) | 18 | 5 | 23  S2 (bottom) | 1 | 16 | 17  --------------------  For S1: P(high) = 18/23 = 0.78 and P(low) = 5/23 = 0.22  For S2: P(high) = 1/17 = 0.06 and P(low) = 16/17 = 0.94  Gini(S1) = 1-[0.78x0.78 + 0.22x0.22] = 1-[0.61+0.05] = 1-0.66 = 0.34  Gini(S2) = 1-[0.06x0.06 + 0 94x0 94] = 1-[0 004+0 884] = 1-0 89 = 0 11 1-[0 06x0 06 0.94x0.94] 1-[0.004+0.884] 1-0.89 0.11  Gini-Split(Age<=50) = 23/40 x 0.34 + 17/40 x 0.11 = 0.20 + 0.05 = 0.25 R. Akerkar 27
  • 28. Exercise 3  In previous exercise which is a better split of exercise, the data among the two split points? Why? R. Akerkar 28
  • 29. Solution 3  Intuitively Salary <= 65K is a better split point since it produces relatively ``pure'' partitions as opposed to Age <= 50 which pure'' 50, results in more mixed partitions (i.e., just look at the distribution of Highs and Lows in S1 and S2).  More formally, let us consider the properties of the Gini index. If a partition is totally pure, i.e., has all elements from the same class, then gini(S) = 1-[1x1+0x0] = 1-1 = 0 (for two classes). On the other hand if the classes are totally mixed, i.e., both classes have equal probability then gini(S) = 1 - [0 5x0 5 + 0 5x0 5] = 1 [0 25+0 25] = 0 5 [0.5x0.5 0.5x0.5] 1-[0.25+0.25] 0.5. In other words the closer the gini value is to 0, the better the partition is. Since Salary has lower gini it is a better split. is split R. Akerkar 29
  • 30. Avoid Overfitting in Classification vo d v g C ss c o  Overfitting: An induced tree may overfit the training data  Too many branches, some may reflect anomalies due to noise or outliers  Poor accuracy for unseen samples y p  Two approaches to avoid overfitting  Prepruning: Halt tree construction early—do not split a node if this would result in the goodness measure falling below a threshold  Difficult to choose an appropriate threshold  Postpruning: Remove branches from a “fully grown” tree—get a sequence of progressively pruned t f i l d trees  Use a set of data different from the training data to decide which is the “best pruned tree” R. Akerkar 30