


Decision trees in Machine Learning
- 2. Introduction Decision trees Decision trees are a model where we break our data by making decisions using series of conditions(questions).
- 3. Decision tree algorithm ● These are also termed as CART algorithms. ● These are used for ○ Classification and ○ Regression ● Classification and Regression Trees
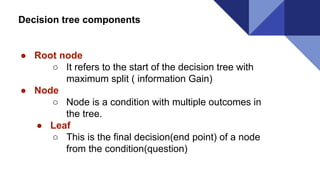
- 4. Decision tree components ● Root node ○ It refers to the start of the decision tree with maximum split ( information Gain) ● Node ○ Node is a condition with multiple outcomes in the tree. ● Leaf ○ This is the final decision(end point) of a node from the condition(question)
- 6. Every node yields maximum data in each split which could be achieved by IG Information Gain ( IG )
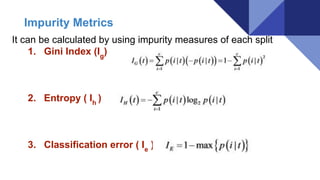
- 7. It can be calculated by using impurity measures of each split 1. Gini Index (Ig ) 2. Entropy ( Ih ) 3. Classification error ( Ie ) Impurity Metrics
- 8. ● Root node is split to get maximum info gain. ● Increase in nodes in the tree causes overfitting. ● Splitting continues until each of the leaf is pure ( one of the possible outcome ) ● Pruning can also be done which means removal of branches which use features of low importance. ● Gini index ≅ Entropy ● If uniform distribution , entropy is 1 Principle of spliting nodes
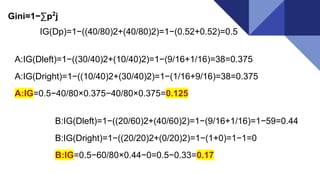
- 9. Split A Parent data set ---> 40 items in feature 1 and 40 items in feature 2 Child 1 → 30 items in feature 1 and 10 items in feature 2 Child 2 → 10 items in feature 1 and 30 items in feature 2 Split B Parent data set ---> 40 items in feature 1 and 40 items in feature 2 Child 1 → 20 items in feature 1 and 40 items in feature 2 Child 2 → 20 items in feature 1 and 0 items in feature 2
- 13. Comparison of all Impurity Metrics Scaled Entropy = Entropy /2 Gini index is intermediate values of impurity lying between classification error and Entropy .
- 14. Pros : ● Simple to understand, interpret, visualize. ● It is effective to use in numerical and categorical data outcomes. ● Requires little effort from users for data preparation. ● Nonlinear relationships between parameters do not affect tree performance. ● Able to handle irrelevant attributes ( Gain = 0 )
- 15. Cons : ● May make a complex tree with maximum depth. ● Unstable as small variation in input data may result in completely different tree to get generated. ● As it is a greedy algorithm , may not find globally best tree for a data set .
- 16. Applications : 1. Business Management 2. Customer Relationship Management 3. Fraudulent Statement Detection 4. Engineering 5. Energy Consumption 6. Fault Diagnosis 7. Healthcare Management
- 17. References : ● Python Machine Learning By Sebastian Raschka ● https://towardsdatascience.com/decision-trees-in-machine-learning-641b9c4e8 052 ● https://www.bogotobogo.com/python/scikit-learn/scikt_machine_learning_Decis ion_Tree_Learning_Informatioin_Gain_IG_Impurity_Entropy_Gini_Classificatio n_Error.php ● https://media.ed.ac.uk/media/Pros+and+cons+of+decision+trees/1_p4gyge5m ● https://www.ncbi.nlm.nih.gov/pmc/articles/PMC4466856/ ● http://what-when-how.com/artificial-intelligence/decision-tree-applications-for-d ata-modelling-artificial-intelligence/
- 18. Let’s code now Data used : Iris from Sklearn Plots : Matplotlib Splits : Two features at a time File : dtree.py Link to code : Click here for code
- 19. Thank You