


Demography lecture ppt
- 2. Demography, as understood today, is the scientific study of human population. It focuses its attention on three readily observable human phenomena : (a) changes in population size (growth or decline) (b) the composition of the population and (c) the distribution of population in space. It deals with five "demographic processes", namely fertility, mortality, marriage, migration and social mobility. These five processes are continuously at work within a population determining size, composition and distribution.
- 5. The history of world population since 1650 suggests that there is a demographic cycle of 5 stages through which a nation passes: (1) FIRST STAGE (High stationary): This stage is characterized by a high birth rate and a high death rate which cancel each other and the population remains stationary. India was in this stage till 1920. (2) SECOND STAGE (Early expanding): The death rate begins to decline, while the birth rate remains unchanged. Many countries in South Asia, and Africa are in this phase. Birth rates have increased in some of these countries possibly as a result of improved health conditions, and shortening periods of breast-feeding
- 6. (3) THIRD STAGE (Late expanding): The death rate declines still further, and the birth rate tends to fall. The population continues to grow because births exceed deaths. India has entered this phase. In a number of developing countries (e.g., China, Singapore) birth rates have declined rapidly. (4) FOURTH STAGE (Low stationary) : This stage is characterized by a low birth and low death rate with the result that the population becomes stationary. Zero population growth has already been recorded in Austria during 1980-85. Growth rates as little as 0.1 were recorded in UK, Denmark, Sweden and Belgium during 1980-85. In short, most industrialized countries have undergone a demographic transition shifting from a high
- 7. birth and high death rates to low birth and low death rates. (5) FIFTH STAGE: (Declining) The population begins to decline because birth rate is lower than the death rate. Some East European countries, notably Germany and Hungary are experiencing this stage.
- 8. Growth rates : When the crude death rate is substracted from the crude birth rate, the net residual is the current annual growth rate,exclusive of migration.
- 11. Demographic indicators have been divided into two parts –1.Population statistics and 2. vital statistics Population statistics include indicators that measure the population size, sex ratio, density and dependency ratio. Vital statistics include indicators such as birth rate, death rate, natural growth rate, life expectancy at birth, mortality and fertility rates. These indicators help in identifying areas that need policy and programmed interventions, setting near and far-term goals and deciding priorities, besides understanding them in an integrated structure.
- 33. By fertility is meant the actual bearing of children. Some demographers prefer to use the word natality in place of fertility. A woman's reproductive period is roughly from 15 to 45 years - a period of 30 years. A woman married at 15 and living till 45 with her husband is exposed to the risk of pregnancy for 30 years, and may give birth to 15 children, but this maximum is rarely achieved.
- 34. Fertility depends upon several factors. These are described below- 1. Age at marriage: The age at which a female marries and enters the reproductive period of life has a great impact on her fertility. The Registrar General of India collected data on fertility on a national scale and found that females who marry before the age of 18 gave birth to a larger number of children than those who married after . In India some demographers have estimated that if marriages were postponed from the age of 16 to 20-21, the number of births would decrease by 20-30 per cent .
- 35. 2. Duration of married life: Studies indicate that 10-25 per cent of all births occur within 1-5 years of married life; 50-55 per cent of all births within 5-15 years of married life. Births after 25 years of married life are very few . This suggests that family planning efforts should be concentrated in the first few years of married life in order to achieve tangible results.
- 36. 3. Spacing of children : Studies have shown that when all births are postponed by one year, in each age group, there was a decline in total fertility. It follows that spacing of children may have a significant impact on the general reduction in the fertility rates. 4. Education : There is an inverse association between fertility and educational status. Education provides knowledge; increased exposure to information and media; builds skill for gainful employment; increases female participation in family decision making; and raises the opportunity costs of women's time.
- 37. 5. Economic status : Operational Research studies support the hypothesis that economic status bears an inverse relationship with fertility. The total number of children born declines with an increase in per capita expenditure of the household. The World Population Conference at Bucharest in fact stressed that economic development is the best contraceptive. It will take care of population growth and bring about reductions in fertility. 6. Caste and religion : Muslims have a higher fertility than Hindus. The National
- 38. Family Health Survey-3 reported a total fertility rate of 3.09 among Muslims as compared to 2.65 among Hindus. Among Hindus, the lower castes seem to have a higher fertility rate than the higher castes. 7. Nutrition : There appears to be some relationship between nutritional status and fertility levels. Virtually, all well-fed societies have low fertility, and poorly-fed societies high fertility. The effect of nutrition on fertility is largely indirect.
- 39. 8. Family planning : Family planning is another important factor in fertility reduction. In a number of developing countries, family planning has been a key factor in declining fertility. Family planning programmes can be initiated rapidly and require only limited resources, as compared to other factors.
- 40. 9. Other factors : Fertility is affected by a number of physical, biological,social and cultural factors such as place of women in society, value of children in society, widow remarriage, breastfeeding, customs and beliefs, industrialization and urbanization, better health conditions, housing, opportunities for women and local community involvement. Attention to these factors requires long-term government programmes and vast sums of money.
- 42. Fertility may be measured by a number of indicators, as given below. Stillbirths, foetal deaths and abortions,however, are not included in the measurement of fertility in a population.- 1. Birth Rate 2. General Fertility Rate (GFR) 3. General Marital Fertility Rate (GMFR) 4. Age-specific Fertility Rate (ASFR) 5. Age-specific Marital Fertility Rate (ASMFR)
- 43. 6. Total Fertility Rate (TFR) 7. Total Marital Fertility Rate (TMFR) 8. Gross Reproduction Rate (GRR) 9. Net Reproduction Rate (NRR) 10. Child-woman Ratio 11. Pregnancy Rate 12. Abortion Rate 13. Abortion Ratio 14. Marriage Rate
- 44. Birth rate is the simplest indicator of fertility and is defined as "the number of live births per 1000 estimated mid-year population, in a given year". It is given by the formula: The birth rate is an unsatisfactory measure of fertility because the total population is not exposed to child bearing. Therefore it does not give a true idea of the fertility of a Population.
- 46. It is the "number of live births per 1000 women in there productive age-group (15-44 or 49 years) in a given year". General fertility rate is a better measure of fertility than the crude birth rate because the denominator is restricted to the number of women in the child-bearing age, rather than the whole population. The major weakness of this rate is that not all women in the denominator are exposed to the risk of childbirth.
- 48. It is the "number of live births per 1000 married women in the reproductive age group (15-44 or 49) in a given year".
- 50. A more precise measure of fertility is age- specific fertility rate, defined as the "number of live births in a year to 1000 women in any specified age-group". The age-specific fertility rates throw light on the fertility pattern. They are also sensitive indicators of family planning achievement.
- 52. It is the number of live births in a year to 1000 married women in any specified age group.
- 54. Total fertility rate represents the average number of children a woman would have if she were to pass through her reproductive years bearing children at the same rates as the women now in each age group . . It is computed by summing the age-specific fertility rates for all ages; if 5-year age groups are used, the sum of the rates is multiplied by 5. This measure gives the approximate magnitude of "completed family size".
- 56. Average number of children that would be born to a married woman if she experiences the current fertility pattern throughout her reproductive span.
- 58. Average number of girls that would be born to a woman if she experiences the current fertility pattern throughout her reproductive span (15- 44 or 49 years), assuming no mortality.
- 60. Net Reproduction Rate (NRR) is defined as the number of daughters a newborn girl will bear during her lifetime assuming fixed age-specific fertility and mortality rates . NRR is a demographic indicator. NRR of 1 is equivalent to attaining approximately the 2- child norm. If the NRR is less than 1, then the reproductive performance of the population is said to be below replacement level.
- 62. It is the number of children 0-4 years of age per 1000 women of child-bearing age, usually defined as 15-44 or 49 years of age. This ratio is used where birth registration statistics either do not exist or are inadequate. It is estimated through data derived from censuses.
- 66. There are several definitions of family planning. An Expert Committee (1971) of the WHO defined family planning as "a way of thinking and living that is adopted voluntarily, upon the basis of knowledge, attitudes and responsible decisions by individuals and couples, in order to promote the health and welfare of the family group and thus contribute effectively to the social development of a country“.
- 68. "Family planning refers to practices that help individuals or couples to attain certain objectives : · (a) to avoid unwanted births (b) to bring about wanted births {c) to regulate the intervals between pregnancies {d) to control the time at which births occur in relation to the ages of the parent; and {e) to determine the number of children in the family.
- 69. An "eligible couple" refers to a currently married couple wherein the wife is in the reproductive age, which is generally assumed to lie between the ages of 15 and 45.
- 70. the term target couple was applied to couples who have had 2-3 living children, and family planning was largely directed to such couples.
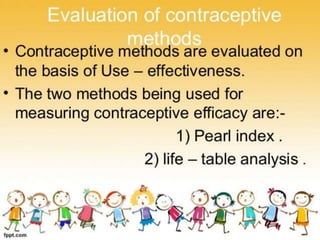
- 71. Couple protection rate (CPR) is an indicator of the prevalence of contraceptive practice in the community. It is defined as the per cent of eligible couples effectively protected against childbirth by one or the other approved methods of family planning, viz. sterilization, IUD, condom or oral pills. Sterilization accounts for over 60 per cent of effectively protected couples . .Demographers are of the view that the demographic goal of NRR= 1 can be achieved only if the CPR exceeds 60 per cent.
- 83. I. Spacing methods 1. Barrier methods (a) Physical methods (b) Chemical methods (c) Combined methods 2. Intra-uterine devices 3. Hormonal methods 4. Post-conceptional methods 5. Miscellaneous. II. Terminal methods 1 Male sterilization 2 Female sterilization
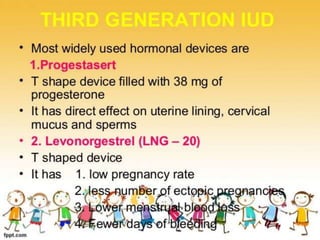
- 99. There are two basic types of IUD : non-medicated and medicated. Both are usually made of polyethylene or other polymers; in addition, the medicated or bioactive IUDs release either metal ions (copper) or hormones (progestogens). The non-medicated or inert IUDs are often referred to as first generation IUDs. The copper IUDs comprise the second and the hormone-releasing IUDs the third generation IUDs. The medicated IUDs were developed to reduce the incidence of side-effects and to increase the contraceptive effectiveness. However, they are more expensive and must be changed after a certain time to maintain their effectiveness .India, under the National Family Welfare Programme, Cu-T-200 B is being used. From the year 2002, Cu-T -380 A has been introduced in the programme .
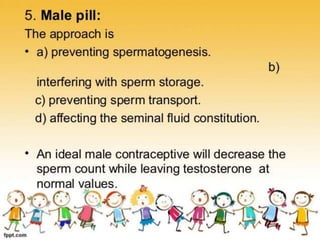
- 131. Hormonal contraceptives currently in use and/or under study may be classified as follows : A. Oral pills 1. Combined pill 2. Progestogen only pill (POP) 3. Post-coital pill 4. Once-a-month (long-acting) pill 5. Male pill B. Depot (slow release} formulations 1. Injectables 2. Subcutaneous implants 3. Vaginal rings Classification
- 207. Census
- 208. Definition : A census is defined by the United Nations as "the total process of collecting, compiling and publishing demographic, economic and social data pertaining at a specified time or times, to all persons in a country or delimited territory"