Location via proxy:   [ UP ]  
[Report a bug]   [Manage cookies]                
SlideShare a Scribd company logo
DigiWorld Summit 2011 November 16, 2011
Verizon Overview Verizon Communications Wireline Wireless FiOS Presence Revenue (2010): $41B Voice subs (3Q11): 24.5M Broadband subs (3Q11): 8.6M FiOS TV subs (3Q11): 4.0M Revenue (2010): $63B Retail Customers (3Q11): 90.7M Smartphone penetration (3Q11): 39% LTE markets (3Q11): 165 markets  (covering population of >186M)
IPTV Is The Link To Multiplatform Consumption  DEMAND DISTRIBUTION DEVICES Device shifting Time shifting Place shifting Higher broadband speeds Cloud storage Content security Picture quality IPTV
Current Content Distribution Linear, VOD Authenticated, VOD, Live Events Linear,  VOD, Apps Multichannel Providers (MVPDs) 300+ Linear Digital Networks 30K VOD Titles MVPDs (Auth) Online only (e.g., Hulu – 18K Titles) Content providers (Ad-supported, Auth) Library content (e.g., Netflix – 30K Titles) Content Availability Nascent Distribution Platforms Content distribution still limited by device In-home streaming MVDP  authenticated apps Hulu Plus, Netflix Watch ESPN, HBO Go apps Mobile only MVPDs (Auth Trial) Hulu Plus, Netflix Content providers Authenticated, VOD, Live Events
Deployed Innovation Authentication OTT Interactivity Content ubiquitous across  devices Reach consumers at every  point of access Drive engagement Multiplatform Consumer aspiration: Favorite content anywhere, anytime IPTV Expands Content Reach
Authentication Overview In-Home (Live and VOD) Out-of-Home Authenticated Content Access MVPD Programmer Site 3 rd  Party Authenticator iPad App Sling  Adapter Xbox Limited  Availability Players Devices Players Devices Authentication reinforces value of underlying video subscription
90% of HHs will connect TVs to internet by 2015 Est 1.4 OTT subscriptions per  OTT HH by 2015, many households with have 2-3 subscriptions Most OTT subs will be  Complementors  – users supplementing current multichannel subscription with OTT Widely available broadband speeds for streaming… More than 75% of Households can stream SD video (2+ Mbps) More than 25% of Households can stream HD video (7+Mbps) …  and growing fast Large installed base of networked devices… Broad range of content offered… …  about to triple by 2014 2010 128M 2014 368M …  and more to come …  and a growing Video OTT Market Movies TV Shows Sports more than 40% of HHs paying for video OTT  Million OTT Paying HHs US market is primed for OTT Growth: from $6B in 2011 to $19B in 2015  US OTT Market Overview Game Consoles 89M  Internet TVs 107M  Blu-Ray Players 89M   STB / DVR 82M
US OTT Competition Subscription EST/Rental Ad Supported Business Model Content Aggregators Content Creators OTT competitors are differentiating themselves based on a combination of: Content  – high-affinity content or niche content Access  – availability across platforms and devices Price  – business models ranging from ad-supported to EST/Rental Current competitors include content aggregators and content creators Opportunity for new competition such as MVPDs who also offer high-speed data services
Key Factors Consumer Behavior Device Proliferation Platform Content Availability Consumer Expectation Opportunity Time shifting, place shifting,  device shifting High-affinity content New revenue OTT subscription revenue Additional advertising revenue Rental/EST revenue Expand subscription market  beyond multichannel Increase from 100M HHs to 150+M subs (US) Drive device sales Expand number of devices per customer IPTV Opportunity Summary

More Related Content

Verizon Overview Broadband during DigiWorld Summit 2011

  • 1. DigiWorld Summit 2011 November 16, 2011
  • 2. Verizon Overview Verizon Communications Wireline Wireless FiOS Presence Revenue (2010): $41B Voice subs (3Q11): 24.5M Broadband subs (3Q11): 8.6M FiOS TV subs (3Q11): 4.0M Revenue (2010): $63B Retail Customers (3Q11): 90.7M Smartphone penetration (3Q11): 39% LTE markets (3Q11): 165 markets (covering population of >186M)
  • 3. IPTV Is The Link To Multiplatform Consumption DEMAND DISTRIBUTION DEVICES Device shifting Time shifting Place shifting Higher broadband speeds Cloud storage Content security Picture quality IPTV
  • 4. Current Content Distribution Linear, VOD Authenticated, VOD, Live Events Linear, VOD, Apps Multichannel Providers (MVPDs) 300+ Linear Digital Networks 30K VOD Titles MVPDs (Auth) Online only (e.g., Hulu – 18K Titles) Content providers (Ad-supported, Auth) Library content (e.g., Netflix – 30K Titles) Content Availability Nascent Distribution Platforms Content distribution still limited by device In-home streaming MVDP authenticated apps Hulu Plus, Netflix Watch ESPN, HBO Go apps Mobile only MVPDs (Auth Trial) Hulu Plus, Netflix Content providers Authenticated, VOD, Live Events
  • 5. Deployed Innovation Authentication OTT Interactivity Content ubiquitous across devices Reach consumers at every point of access Drive engagement Multiplatform Consumer aspiration: Favorite content anywhere, anytime IPTV Expands Content Reach
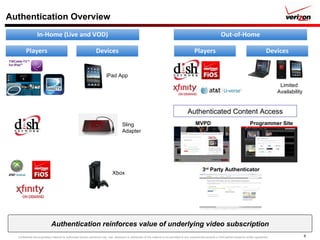
  • 6. Authentication Overview In-Home (Live and VOD) Out-of-Home Authenticated Content Access MVPD Programmer Site 3 rd Party Authenticator iPad App Sling Adapter Xbox Limited Availability Players Devices Players Devices Authentication reinforces value of underlying video subscription
  • 7. 90% of HHs will connect TVs to internet by 2015 Est 1.4 OTT subscriptions per OTT HH by 2015, many households with have 2-3 subscriptions Most OTT subs will be Complementors – users supplementing current multichannel subscription with OTT Widely available broadband speeds for streaming… More than 75% of Households can stream SD video (2+ Mbps) More than 25% of Households can stream HD video (7+Mbps) … and growing fast Large installed base of networked devices… Broad range of content offered… … about to triple by 2014 2010 128M 2014 368M … and more to come … and a growing Video OTT Market Movies TV Shows Sports more than 40% of HHs paying for video OTT Million OTT Paying HHs US market is primed for OTT Growth: from $6B in 2011 to $19B in 2015 US OTT Market Overview Game Consoles 89M Internet TVs 107M Blu-Ray Players 89M STB / DVR 82M
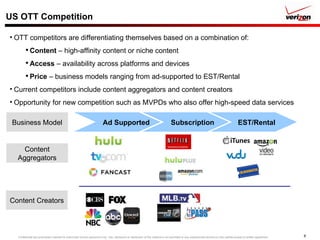
  • 8. US OTT Competition Subscription EST/Rental Ad Supported Business Model Content Aggregators Content Creators OTT competitors are differentiating themselves based on a combination of: Content – high-affinity content or niche content Access – availability across platforms and devices Price – business models ranging from ad-supported to EST/Rental Current competitors include content aggregators and content creators Opportunity for new competition such as MVPDs who also offer high-speed data services
  • 9. Key Factors Consumer Behavior Device Proliferation Platform Content Availability Consumer Expectation Opportunity Time shifting, place shifting, device shifting High-affinity content New revenue OTT subscription revenue Additional advertising revenue Rental/EST revenue Expand subscription market beyond multichannel Increase from 100M HHs to 150+M subs (US) Drive device sales Expand number of devices per customer IPTV Opportunity Summary