Location via proxy:   [ UP ]  
[Report a bug]   [Manage cookies]                
SlideShare a Scribd company logo
Integrated modelling for interrelated crises
Detlef van Vuuren
1
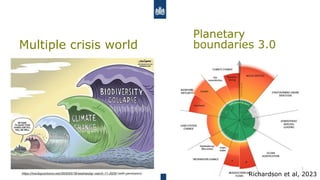
Multiple crisis world
2 mei 2024
2
Multiple crisis world
2 mei 2024
3
Planetary
boundaries 3.0
Richardson et al, 2023
4
Planetary
boundaries 3.0
• 800 million people without access to
electricity
• 828 million people suffering from a hunger
(2021)
• 2.2 billion people lacking access to safely
managed clean water (2022)
• 3.6 billion people lack access to adequate
sanitation
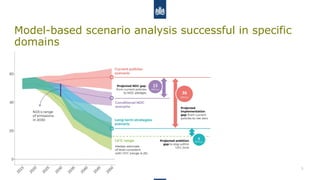
Model-based scenario analysis successful in specific
domains
2 mei 2024
5
15 mei 2012
Drivers
Human system
Earth system
Impacts
Response
Rio+20, 15 mei 2012
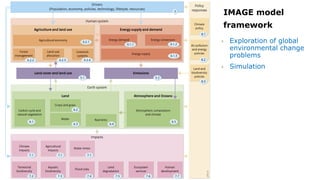
IMAGE model
framework
› Exploration of global
environmental change
problems
› Simulation
Some examples of studies looking into addressing
multiple crises
› SHAPE (EU sponsored project on achieving SDGs)
› GEO7 (UNEP Global Environmental Outlook)
› IMAGE Planetary Boundary work
2 mei 2024
8
Storylines + modelling
Economy driven innovation
• Technology & market driven
• Globalized world with high
economic growth
• Technological solutions
Managing the global commons
• Human services driven
• Strong global institutions
• Efficient technological solutions
Resilient communities
• Post-growth society
• Local solutions
• Human well-being & behavioural
change
› SHAPE scenarios based on SDG
achievement (target space)
› Multiple routes – different
transformations
› Each have strengths and
weaknesses
Detlef Van Vuuren- Integrated modelling for interrelated crises.pdf
2 mei 2024
Buildings
Transport
Interventions
• HT = Historical Trends
• SSP2 baseline
• RE = Resource Efficiency
• Reduced (material)
demands
• Efficient design
• Increased Recycling
• ST = Sustainable
Transition (RE + 1.5°C)
Emissions
Example of reduced material demand (GRO)
12
Primary Energy
- Primary Energy stabilizes (efficiency)
- Continued use of fossil fuels
(combined with CCS)
- Rapid transition to renewables
- Focus on large scale renewables
- Long term reduction in demand
- Reduction in demand (behaviour)
- Slower transition to renewables
- Lower trade
- Continued increase in demand
- Continued reliance on fossil (+CCS)
SSP2-RCP1.9
RC
EI
MC
RC
MC
EI
RC
MC
Vassilis Daioglou - The IMAGE Sustainable Development Pathways
13
- Small expansion on agriculture (high
demand and high yields)
- Expansion of forest area
- At expense of pasture area
- Similar to Economic-Innovation but
with more natural land
- Small expansion of agriculture
(lower yield increase)
- Large expansion of forest area
- Decrease of pasture area
- Strong afforestation (single species)
and intensive agriculture
SSP2-RCP1.9
Land Cover
EI
RC
MC
Vassilis Daioglou - The IMAGE Sustainable Development Pathways
14
Emissions
- Slowest mitigation of all the SDPs
- Significant CDR from land, energy
& DAC
- Net negative from 2050
- “Limited” CDR, mostly from BECCS
- Energy demand emissions
approach net zero after 2050
- Limited CDR, mostly from land
sector
- Energy demand emissions
approach net zero after 2050
- “slower” mitigation
- Heavy reliance on CDR
SSP2-RCP1.9
EI
RC
MC
Vassilis Daioglou - The IMAGE Sustainable Development Pathways
15
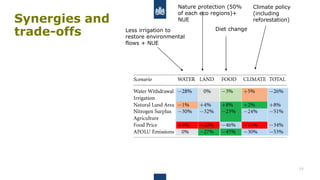
Synergies and
trade-offs Less irrigation to
restore environmental
flows + NUE
Nature protection (50%
of each eco regions)+
NUE
Diet change
Climate policy
(including
reforestation)
16
Synergies and
trade-offs Less irrigation to
restore environmental
flows + NUE
Nature protection (50%
of each eco regions)+
NUE
Diet change
Climate policy
(including
reforestation)
Trade-offs
Climate policy
(including
reforestation)
18
Earth-system process Control variable *
Climate change Forcing - GHGs (W m-2)
Stratospheric ozone
depletion
O3 concentration (DU) 60S-90S
Atmospheric aerosol
loading
Average pm2.5 concentration (g
m-3)
Ocean acidification pH
Biogeochemical flows
-Nitrogen
-Phosphorus N-balance (Tg N yr–1)
P-balance (Tg P yr–1)
Freshwater use Water consumption (km3)
Land system change Area of forested land (Gha)
Change in biosphere
integrity
MSA
Planetary boundaries
› Current trends (SSP2)
implies further
worsening of
environmental
situation
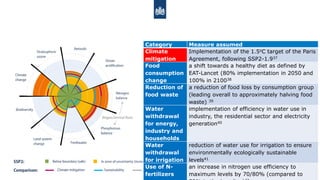
Category Measure assumed
Climate mitigation Implementation of the 1.5oC target of the Paris Agreement, following
SSP2-1.937
Food consumption
change
a shift towards a healthy diet as defined by EAT-Lancet (80%
implementation in 2050 and 100% in 210038
Reduction of food
waste
a reduction of food loss by consumption group (leading overall to
approximately halving food waste) 39
Water withdrawal
for energy, industry
and households
implementation of efficiency in water use in industry, the residential
sector and electricity generation40
Water withdrawal
for irrigation
reduction of water use for irrigation to ensure environmentally
ecologically sustainable levels41
Use of N-fertilizers an increase in nitrogen use efficiency to maximum levels by 70/80%
(compared to 50% in the baseline)42
Sustainability measures
Category Measure assumed
Climate
mitigation
Implementation of the 1.5oC target of the Paris
Agreement, following SSP2-1.937
Food
consumption
change
a shift towards a healthy diet as defined by
EAT-Lancet (80% implementation in 2050 and
100% in 210038
Reduction of
food waste
a reduction of food loss by consumption group
(leading overall to approximately halving food
waste) 39
Water
withdrawal
for energy,
industry and
households
implementation of efficiency in water use in
industry, the residential sector and electricity
generation40
Water
withdrawal
for irrigation
reduction of water use for irrigation to ensure
environmentally ecologically sustainable
levels41
Use of N-
fertilizers
an increase in nitrogen use efficiency to
maximum levels by 70/80% (compared to
Some obervations
22
Vassilis Daioglou - The IMAGE Sustainable Development Pathways
➢ Need to develop more integrated scenarios
➢ Major transformations needed (demand + supply)
➢ Critical to focus more of just implementation
➢ Mixed methods can help us to better understand the
transitions (economic / physical models / governance)

More Related Content

Detlef Van Vuuren- Integrated modelling for interrelated crises.pdf

  • 1. Integrated modelling for interrelated crises Detlef van Vuuren 1
  • 3. Multiple crisis world 2 mei 2024 3 Planetary boundaries 3.0 Richardson et al, 2023
  • 4. 4 Planetary boundaries 3.0 • 800 million people without access to electricity • 828 million people suffering from a hunger (2021) • 2.2 billion people lacking access to safely managed clean water (2022) • 3.6 billion people lack access to adequate sanitation
  • 5. Model-based scenario analysis successful in specific domains 2 mei 2024 5
  • 6. 15 mei 2012 Drivers Human system Earth system Impacts Response
  • 7. Rio+20, 15 mei 2012 IMAGE model framework › Exploration of global environmental change problems › Simulation
  • 8. Some examples of studies looking into addressing multiple crises › SHAPE (EU sponsored project on achieving SDGs) › GEO7 (UNEP Global Environmental Outlook) › IMAGE Planetary Boundary work 2 mei 2024 8 Storylines + modelling
  • 9. Economy driven innovation • Technology & market driven • Globalized world with high economic growth • Technological solutions Managing the global commons • Human services driven • Strong global institutions • Efficient technological solutions Resilient communities • Post-growth society • Local solutions • Human well-being & behavioural change › SHAPE scenarios based on SDG achievement (target space) › Multiple routes – different transformations › Each have strengths and weaknesses
  • 11. 2 mei 2024 Buildings Transport Interventions • HT = Historical Trends • SSP2 baseline • RE = Resource Efficiency • Reduced (material) demands • Efficient design • Increased Recycling • ST = Sustainable Transition (RE + 1.5°C) Emissions Example of reduced material demand (GRO)
  • 12. 12 Primary Energy - Primary Energy stabilizes (efficiency) - Continued use of fossil fuels (combined with CCS) - Rapid transition to renewables - Focus on large scale renewables - Long term reduction in demand - Reduction in demand (behaviour) - Slower transition to renewables - Lower trade - Continued increase in demand - Continued reliance on fossil (+CCS) SSP2-RCP1.9 RC EI MC RC MC EI RC MC Vassilis Daioglou - The IMAGE Sustainable Development Pathways
  • 13. 13 - Small expansion on agriculture (high demand and high yields) - Expansion of forest area - At expense of pasture area - Similar to Economic-Innovation but with more natural land - Small expansion of agriculture (lower yield increase) - Large expansion of forest area - Decrease of pasture area - Strong afforestation (single species) and intensive agriculture SSP2-RCP1.9 Land Cover EI RC MC Vassilis Daioglou - The IMAGE Sustainable Development Pathways
  • 14. 14 Emissions - Slowest mitigation of all the SDPs - Significant CDR from land, energy & DAC - Net negative from 2050 - “Limited” CDR, mostly from BECCS - Energy demand emissions approach net zero after 2050 - Limited CDR, mostly from land sector - Energy demand emissions approach net zero after 2050 - “slower” mitigation - Heavy reliance on CDR SSP2-RCP1.9 EI RC MC Vassilis Daioglou - The IMAGE Sustainable Development Pathways
  • 15. 15 Synergies and trade-offs Less irrigation to restore environmental flows + NUE Nature protection (50% of each eco regions)+ NUE Diet change Climate policy (including reforestation)
  • 16. 16 Synergies and trade-offs Less irrigation to restore environmental flows + NUE Nature protection (50% of each eco regions)+ NUE Diet change Climate policy (including reforestation)
  • 18. 18 Earth-system process Control variable * Climate change Forcing - GHGs (W m-2) Stratospheric ozone depletion O3 concentration (DU) 60S-90S Atmospheric aerosol loading Average pm2.5 concentration (g m-3) Ocean acidification pH Biogeochemical flows -Nitrogen -Phosphorus N-balance (Tg N yr–1) P-balance (Tg P yr–1) Freshwater use Water consumption (km3) Land system change Area of forested land (Gha) Change in biosphere integrity MSA Planetary boundaries
  • 19. › Current trends (SSP2) implies further worsening of environmental situation
  • 20. Category Measure assumed Climate mitigation Implementation of the 1.5oC target of the Paris Agreement, following SSP2-1.937 Food consumption change a shift towards a healthy diet as defined by EAT-Lancet (80% implementation in 2050 and 100% in 210038 Reduction of food waste a reduction of food loss by consumption group (leading overall to approximately halving food waste) 39 Water withdrawal for energy, industry and households implementation of efficiency in water use in industry, the residential sector and electricity generation40 Water withdrawal for irrigation reduction of water use for irrigation to ensure environmentally ecologically sustainable levels41 Use of N-fertilizers an increase in nitrogen use efficiency to maximum levels by 70/80% (compared to 50% in the baseline)42 Sustainability measures
  • 21. Category Measure assumed Climate mitigation Implementation of the 1.5oC target of the Paris Agreement, following SSP2-1.937 Food consumption change a shift towards a healthy diet as defined by EAT-Lancet (80% implementation in 2050 and 100% in 210038 Reduction of food waste a reduction of food loss by consumption group (leading overall to approximately halving food waste) 39 Water withdrawal for energy, industry and households implementation of efficiency in water use in industry, the residential sector and electricity generation40 Water withdrawal for irrigation reduction of water use for irrigation to ensure environmentally ecologically sustainable levels41 Use of N- fertilizers an increase in nitrogen use efficiency to maximum levels by 70/80% (compared to
  • 22. Some obervations 22 Vassilis Daioglou - The IMAGE Sustainable Development Pathways ➢ Need to develop more integrated scenarios ➢ Major transformations needed (demand + supply) ➢ Critical to focus more of just implementation ➢ Mixed methods can help us to better understand the transitions (economic / physical models / governance)