


Dgc 16 05_10-12 - BAML conference
- 1. 1 CANADA’S INTERMEDIATE GOLD PRODUCER 2016 Global Metals, Mining & Steel Conference May 9-12, 2016
- 2. 2 Forward Looking Information This presentation contains certain forward-looking information and statements as defined in applicable securities law (referred to herein as “forward-looking statements”). Forward-looking statements include, but are not limited to, statements with respect to strategic focus, 2016 guidance (gold production, total cash costs, all-in sustaining costs, additional non-sustaining capital, capital expenditures, capitalized stripping, corporate G&A and exploration costs), repayment of $125 M and refinancing <$300 million of the Convertible Notes before due date, expected future production and mining activities, opportunities to optimize the operation, life of mine plan (gold production profile), testing plant capacity, filing an EA for West Detour in Q3’16, proceeding with a preliminary cost estimate and infrastructure design for Zone 58N, and continuation of exploration activities. Forward-looking statements involve known and unknown risks, uncertainties and other factors which may cause actual results, performance or achievements to be materially different from any of its future results, performance or achievements expressed or implied by forward- looking statements. These risks, uncertainties and other factors include, but are not limited to, assumptions and parameters underlying the life of mine plan not being realized, a decrease in the future gold price, discrepancies between actual and estimated production, changes in costs (including labour, supplies, fuel and equipment), changes to tax rates; environmental compliance and changes in environmental legislation and regulation, exchange rate fluctuations, general economic conditions and other risks involved in the gold exploration and development industry, as well as those risk factors discussed in the section entitled “Description of Business - Risk Factors” in Detour Gold’s 2015 AIF and in the continuous disclosure documents filed by Detour Gold on and available on SEDAR at www.sedar.com. Such forward-looking statements are also based on a number of assumptions which may prove to be incorrect, including, but not limited to, assumptions about the following: the availability of financing for exploration and development activities; operating and sustaining capital costs; the Company’s ability to attract and retain skilled staff; sensitivity to metal prices and other sensitivities; the supply and demand for, and the level and volatility of the price of, gold; the supply and availability of consumables and services; the exchange rates of the Canadian dollar to the U.S. dollar; energy and fuel costs; the accuracy of reserve and resource estimates and the assumptions on which the reserve and resource estimates are based; market competition; ongoing relations with employees and impacted communities and general business and economic conditions. Accordingly, readers should not place undue reliance on forward-looking statements. The forward-looking statements contained herein are made as of the date hereof, or such other date or dates specified in such statements. All forward-looking statements in this presentation are necessarily based on opinions and estimates made as of the date such statements are made and are subject to important risk factors and uncertainties, many of which cannot be controlled or predicted. Detour Gold undertakes no obligation to update publicly or otherwise revise any forward-looking statements contained herein whether as a result of new information or future events or otherwise, except as may be required by law. All amounts are in US dollars except as noted.
- 3. 3 Notes to Investors Qualified Persons The scientific and technical content of this presentation was reviewed, verified and approved by Drew Anwyll, P.Eng., Senior Vice President Technical Services, and exploration results was reviewed, verified and approved by Guy MacGillivray, P.Geo., Exploration Manager , both Qualified Person as defined by Canadian Securities Administrators National Instrument 43-101 “Standards of Disclosure for Mineral Projects”. Information Containing Estimates of Mineral Reserves and Resources The mineral reserve and resource estimates reported in this presentation were prepared in accordance with Canadian National Instrument 43- 101Standards of Disclosure for Mineral Projects (“NI 43-101”), as required by Canadian securities regulatory authorities. For United States reporting purposes, the United States Securities and Exchange Commission (“SEC”) applies different standards in order to classify mineralization as a reserve. In particular, while the terms “measured,” “indicated” and “inferred” mineral resources are required pursuant to NI 43-101, the SEC does not recognize such terms. Canadian standards differ significantly from the requirements of the SEC. Investors are cautioned not to assume that any part or all of the mineral deposits in these categories constitute or will ever be converted into reserves. In addition, “inferred” mineral resources have a great amount of uncertainty as to their existence and great uncertainty as to their economic and legal feasibility. It cannot be assumed that all or any part of an inferred mineral resource will ever be upgraded to a higher category. Under Canadian securities laws, issuers must not make any disclosure of results of an economic analysis that includes inferred mineral resources, except in rare cases. Non-IFRS Financial Performance Measures The Company has included non-IFRS measures in this presentation: total cash costs and all-in sustaining costs. The Company believes that these measures, in addition to conventional measures prepared in accordance with IFRS, provide investors an improved ability to evaluate the underlying performance of the Company. The non-IFRS measures are intended to provide additional information and should not be considered in isolation or as a substitute for measures of performance prepared in accordance with IFRS. These measures do not have any standardized meaning prescribed under IFRS, and therefore may not be comparable to other issuers. Other companies may calculate these measure differently. Detour Gold reports total cash costs on a sales basis. Total cash costs include production costs such as mining, processing, refining and site administration, agreements with Aboriginal communities, less non-cash share-based compensation and net of silver sales divided by gold ounces sold to arrive at total cash costs per gold ounce sold. The measure also includes other mine related costs incurred such as mine standby costs and current inventory write downs. Production costs are exclusive of depreciation and depletion. Production costs include the costs associated with providing the royalty in kind ounces. The Company believes the measure all-in sustaining costs more fully defines the total costs associated with producing gold. The Company calculates all-in sustaining costs as the sum of total cash costs (as described above), share-based compensation, corporate general and administrative expense, exploration and evaluation expenses that are sustaining in nature, reclamation cost accretion, sustaining capital including deferred stripping, and realized gains and losses on hedges due to operating and capital costs, all divided by the gold ounces sold to arrive at a per ounce figure. Costs excluded from all-in sustaining costs are non-sustaining capital expenditures and exploration costs that are expected to materially increase production, financing costs and tax expense. Consequently, this measure is not representative of all of the Company’s cash expenditures. In addition, the calculation of all-in sustaining costs does not include depreciation and depletion expense as it does not reflect the impact of expenditures incurred in prior periods.
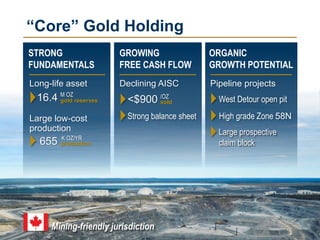
- 4. 4 STRONG FUNDAMENTALS 16.4 M OZ gold reserves 655 K OZ/YR “Core” Gold Holding GROWING FREE CASH FLOW <$900 /OZ sold ORGANIC GROWTH POTENTIAL High grade Zone 58N Long-life asset production Large low-cost production Declining AISC Pipeline projects West Detour open pit Mining-friendly jurisdiction Large prospective claim block Strong balance sheet
- 5. 5 OPERATIONS GROWTH BALANCE SHEET Mine and mill optimization Organic growth valuation Debt reduction Realize on economies of scale Add value with: Maintain capital discipline Satellite deposit development Early-stage project acquisition Shareholder returns Strategic Focus
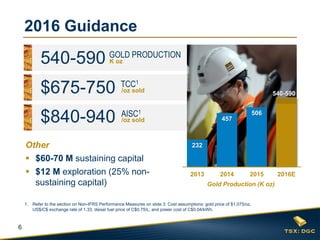
- 6. 6 1. Refer to the section on Non-IFRS Performance Measures on slide 3. Cost assumptions: gold price of $1,075/oz, US$/C$ exchange rate of 1.33, diesel fuel price of C$0.75/L, and power cost of C$0.04/kWh. 2016 Guidance 540-590 GOLD PRODUCTION K oz $675-750 TCC1 /oz sold $840-940 Other $60-70 M sustaining capital $12 M exploration (25% non- sustaining capital) AISC1 /oz sold 232 457 506 2013 2014 2015 2016E Gold Production (K oz) 540-590
- 7. 7 Gold production of 127,136 oz Gold sales of 137,608 oz Strong cash balance of $214 M: › +$7.4 M from flow through financing › +$9.3 M from proceeds of stock option exercises Q1 2016 Highlights 1. Refer to the section on Non-IFRS Performance Measures on slide 3. Reconciliation of these measures is described in the MD&A for Q1’16. $30.8 $637 $824 $214 TCC1 /oz sold AISC1 /oz sold EARNINGS FROM MINE OPERATIONS million CASH BALANCE million
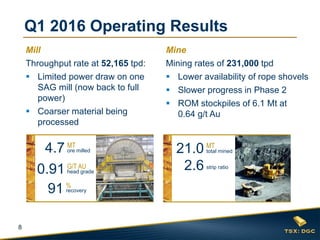
- 8. 8 Q1 2016 Operating Results total mined21.0 MT 2.6 strip ratio MT ore milled 0.91 G/T AU head grade % recovery 4.7 91 Mill Throughput rate at 52,165 tpd: Limited power draw on one SAG mill (now back to full power) Coarser material being processed Mine Mining rates of 231,000 tpd Lower availability of rope shovels Slower progress in Phase 2 ROM stockpiles of 6.1 Mt at 0.64 g/t Au
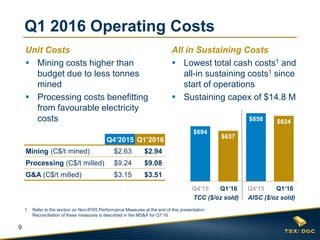
- 9. 9 All in Sustaining Costs Lowest total cash costs1 and all-in sustaining costs1 since start of operations Sustaining capex of $14.8 M Unit Costs Mining costs higher than budget due to less tonnes mined Processing costs benefitting from favourable electricity costs $694 $637 $858 $824 Q4'15 Q1'16 Q4'15 Q1'16 Q1 2016 Operating Costs 1. Refer to the section on Non-IFRS Performance Measures at the end of this presentation. Reconciliation of these measures is described in the MD&A for Q1’16. Q4’2015 Q1’2016 Mining (C$/t mined) $2.63 $2.94 Processing (C$/t milled) $9.24 $9.08 G&A (C$/t milled) $3.15 $3.51 TCC ($/oz sold) AISC ($/oz sold) Q1’16 Q1’16
- 10. 10 $500 $500 $500 $425 $181 $123 2013 2014 2015 Apr. '16 Nov. '17 Short-term Debt ($M) Convertible Notes ($M) On or before Convertible Notes due date: Pay back >$125 M Re-finance <$300 M <$300 Plan for Further Debt Reduction Nov.’17 E ~$200 M debt reduction in just over 1 year April 2016: Purchased $75 M of Convertible Notes
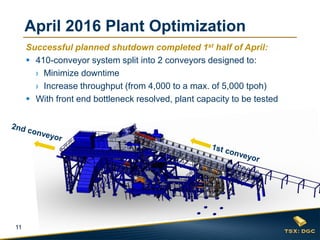
- 11. 11 April 2016 Plant Optimization Successful planned shutdown completed 1st half of April: 410-conveyor system split into 2 conveyors designed to: › Minimize downtime › Increase throughput (from 4,000 to a max. of 5,000 tpoh) With front end bottleneck resolved, plant capacity to be tested
- 12. 12 398 617 607 721 655 2013-15 2016-18 2019-21 2022-24 LOM New LOM Gold Production Profile Grade g/t 0.85 0.98 0.89 1.06 0.99 ~650 koz/yr for next 9 yrs Development of West Detour Incorporate experience gained to date Defer capital Optimize cash flow Improve NPV DE-RISKED OPERATION
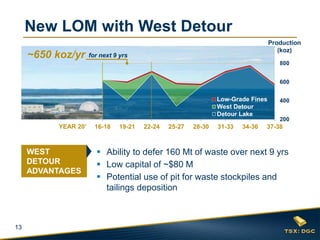
- 13. 13 New LOM with West Detour Ability to defer 160 Mt of waste over next 9 yrs Low capital of ~$80 M Potential use of pit for waste stockpiles and tailings deposition 200 400 600 800 16-18 19-21 22-24 25-27 28-30 31-33 34-36 37-38 Low-Grade Fines West Detour Detour Lake Production (koz) ~650 koz/yr for next 9 yrs YEAR 20’ WEST DETOUR ADVANTAGES
- 14. 14 2015 2016 2017 2018 Permitting Schedule Q2 Q3 Q4 Q1 Q2 Q3 Q4 Q1 Q2 Q3 Q4 Q1 Q2 Q3 Q4 Q1 Baseline Studies Consultation & EA Operating Permits Operation Readiness Pre-stripping (Phase 1) Gold Production West Detour Permitting Schedule Gold Production Projected in Q1 2019 Start equipment procurement this year File Provincial EA in Q3 2019
- 15. 15 8-Year Plan: Find and develop satellite deposits to feed plant with higher grade Modest funding requirement until discovery Organic Growth Valuation 625 km2 Zone 58N Detour Lake Mine West Detour Pipeline Projects West Detour (pre-strip in 2018) Zone 58N (infill drilling)
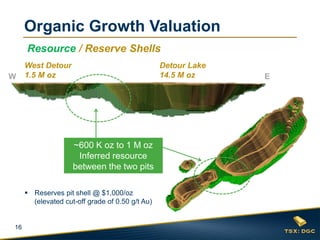
- 16. 16 Organic Growth Valuation Resource / Reserve Shells W E ~600 K oz to 1 M oz Inferred resource between the two pits Detour Lake 14.5 M oz West Detour 1.5 M oz Reserves pit shell @ $1,000/oz (elevated cut-off grade of 0.50 g/t Au)
- 17. 17 Zone 58N 61% of infill drilling program completed › 36,830 m in 119 holes › Program resuming this summer Results received to date are in line with prior results Metallurgical testing underway Proceeding with a preliminary cost estimate for UG exploration program Isometric View (3D) Looking West >3 g/t Au Organic Growth Valuation
- 18. 18 Zone 58N Detour Lake Mine West DetourQ1 Regional Program Lower Detour trend drilling: Completed 9,977 m in 36 holes Geophysical survey: ~147 line km of IP at east end of Lower Detour trend and in tailings facility area Drilling program resuming this summer 5,000-7,000 m to test additional targets along Lower Detour trend and tailings facility area Organic Growth Valuation
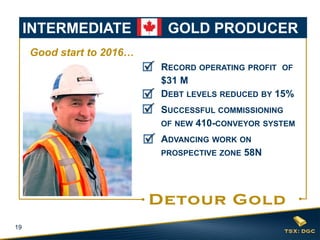
- 19. 19 RECORD OPERATING PROFIT OF $31 M DEBT LEVELS REDUCED BY 15% SUCCESSFUL COMMISSIONING OF NEW 410-CONVEYOR SYSTEM ADVANCING WORK ON PROSPECTIVE ZONE 58N INTERMEDIATE GOLD PRODUCER Good start to 2016…
- 20. 20 ADDITIONAL information Safety Performance Q1 Financial Summary Q1 Operational Statistics LOM Production Plan Year-End 2015 Reserves and Resources Shareholder Information Analyst Coverage Management & Directors Contact Information
- 21. 21 2.5 2.3 1.6 0.0 0.5 1.0 1.5 2.0 2.5 2014 2015 Q1'16 Total Recordable Injury Frequency Rate (TRIFR)1 Safety Performance 1. TRIFR: Total recordable injuries x 200,000 hours divided by total man hours worked. 12 Month Rolling Avg: 2.15
- 22. 22 Q1 2016 Financial Summary Key Financial Statistics ($M, except per share amounts) Q1’16 Metal sales $163.0 Production costs $89.4 Depreciation $42.8 Earnings from mine operations $30.8 Net income/adjusted net earnings1 $27.6 / $11.3 Net income/adjusted net earnings per share1 $0.16 / $0.07 Cash & short-term investments $213.6 1. Refer to the section on Non-IFRS Financial Performance Measures on slide 3.
- 23. 23 Q1 2016 Operational Statistics Q1’15 Q2’15 Q3’15 Q4’15 Q1’16 Ore mined (Mt) 3.8 6.4 6.5 6.3 5.8 Waste mined (Mt) 16.0 19.1 17.0 15.7 15.2 Total mined (Mt) 19.8 25.5 23.5 22.0 21.0 Strip ratio (waste:ore) 4.2 3.0 2.6 2.5 2.6 Mining rate (tpd) 220,000 280,000 255,000 239,000 231,000 Ore milled (Mt) 4.3 5.2 5.2 5.1 4.7 Mill grade (g/t Au) 0.84 0.82 0.86 0.98 0.91 Recovery (%) 91 91 90 91 91 Mill throughput (tpd) 47,797 57,015 56,015 55,522 52,165 Mill availability (%) 78 88 85 86 88 Ounces produced (oz) 105,572 125,348 128,222 146,417 127,136 Ounces sold (oz) 104,497 123,296 126,241 132,209 137,608
- 24. 24 LOM Production Plan Yearly Average per Period Total 2016- 18 2019- 21 2022- 24 2025- 27 2028- 30 2031- 33 2034- 36 2037- 38 LOM LOM Ore milled (Mt) 21.4 23.0 23.0 23.0 23.0 23.0 23.0 18.1 22.4 514 Head grade (g/t Au) 0.98 0.89 1.06 0.89 0.87 1.06 1.15 1.08 0.99 0.99 Gold recovery (%) 91.5 92.0 92.0 92.0 92.0 92.0 92.0 92.0 91.9 91.9 Gold production (k oz) 617 607 721 604 589 719 781 580 655 15,072 Total mined (Mt) 104.8 119.4 118.8 123.2 118.7 88.5 51.5 19.4 96.3 2,214 Strip ratio (waste:ore) 3.8 4.9 3.5 4.9 5.5 2.5 1.4 0.5 3.5 3.5 Technical Report filed on January 25, 2016.
- 25. 25 Year-end 2015 Reserves & Resources Notes: 1. Mineral resources and reserves were completed by Detour Gold in conformity with generally accepted definitions and guidelines given in the Canadian Institute of Mining, Metallurgy and Petroleum (CIM) Standards on Mineral Resources and Mineral Reserves as required by NI 43- 101. 2. Mineral reserves were estimated using a gold price of $1,000/oz and mineral resources were estimated using a gold price of $1,200/oz at a US$/C$ exchange rate of 1.10. 3. Mineral reserves and resources were based on a cut-off grade of 0.50 g/t Au. 4. Mineral reserves included an average mining dilution of 5.3% from 2016 to 2018 and 4% for 2018+, at a diluting grade of 0.20g/t Au. Mining ore loss of 5% also included. 5. Only Probable LG Fines scheduled in the mine plan were reported as mineral reserves. The LG fines reserves were based on a cut-off grade of 0.40 g/t Au. 6. Mineral resources are reported exclusive of mineral reserves. Mineral resources that are not mineral reserves do not have demonstrated economic viability. 7. Totals may not add due to rounding. At Dec. 31, 2015 Reserves Tonnes (millions) Grade (g/t Au) Contained Gold Ounces (000’s oz) Detour Lake Mine Proven 89.2 1.26 3,603 Probable 351.6 0.95 10,779 Stockpiles 4.8 0.64 98 Total P&P 445.5 1.01 14,480 West Detour Proven 1.8 0.99 56 Probable 47.0 0.97 1,473 Total P&P 48.8 0.98 1,529 LG Fines Probable 20.0 0.60 386 Total P&P 514.3 0.99 16,395 Resources Detour Lake Mine Measured 17.4 1.33 746 Indicated 66.2 1.00 2,125 M+I 83.6 1.07 2,871 West Detour Measured 0.4 0.85 10 Indicated 36.5 0.86 1,005 M+I 36.9 0.86 1,015 Total M+I 120.5 1.00 3,886 Detour Lake Mine Inferred 33.7 0.81 875 West Detour Inferred 8.6 0.89 246 Total Inferred 42.3 0.82 1,121
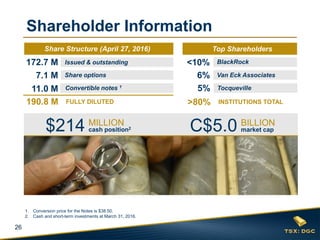
- 26. 26 1. Conversion price for the Notes is $38.50. 2. Cash and short-term investments at March 31, 2016. Shareholder Information >80% INSTITUTIONS TOTAL 7.1 M Share options 11.0 M Convertible notes 1 190.8 M FULLY DILUTED 172.7 M Issued & outstanding Share Structure (03/31/2014) Top Shareholders <10% C$5.0 2 BILLION market cap$214 MILLION cash position2 Share Structure (April 27, 2016) Top Shareholders BlackRock 6% Van Eck Associates 5% Tocqueville
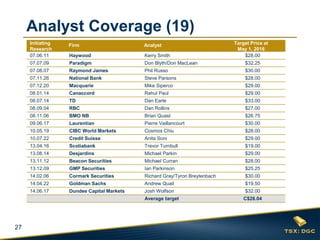
- 27. 27 Initiating Research Firm Analyst Target Price at May 1, 2016 07.06.11 Haywood Kerry Smith $28.00 07.07.09 Paradigm Don Blyth/Don MacLean $32.25 07.08.07 Raymond James Phil Russo $30.00 07.11.26 National Bank Steve Parsons $28.00 07.12.20 Macquarie Mike Siperco $29.00 08.01.14 Canaccord Rahul Paul $29.00 08.07.14 TD Dan Earle $33.00 08.09.04 RBC Dan Rollins $27.00 08.11.06 BMO NB Brian Quast $26.75 09.06.17 Laurentian Pierre Vaillancourt $30.00 10.05.19 CIBC World Markets Cosmos Chiu $28.00 10.07.22 Credit Suisse Anita Soni $29.00 13.04.16 Scotiabank Trevor Turnbull $19.00 13.08.14 Desjardins Michael Parkin $29.00 13.11.12 Beacon Securities Michael Curran $28.00 13.12.09 GMP Securities Ian Parkinson $25.25 14.02.06 Cormark Securities Richard Gray/Tyron Breytenbach $30.00 14.04.22 Goldman Sachs Andrew Quail $19.50 14.06.17 Dundee Capital Markets Josh Wolfson $32.00 Average target C$28.04 Analyst Coverage (19)
- 28. 28 Paul Martin President and CEO Pierre Beaudoin COO James Mavor CFO Drew Anwyll Sr VP Technical Services Julie Galloway Sr VP General Counsel & Corporate Secretary Derek Teevan Sr VP Corporate & Aboriginal Affairs Jean-François Métail VP Mineral Resource Management Ruben Wallin VP Environment & Sustainability Charles Hennessey Mine General Manager Laurie Gaborit Director Investor Relations Alberto Heredia Controller Lisa Colnett Edward C. Dowling Robert E. Doyle André Falzon Alex G. Morrison Jonathan Rubenstein Graham Wozniak Ingrid Hibbard Michael Kenyon Paul Martin Management & Directors Management Directors
- 29. 29 Laurie Gaborit Director Investor Relations Email: lgaborit@detourgold.com Phone: 416.304.0581 James Mavor Chief Financial Officer Email: jmavor@detourgold.com Phone: 416.304.0800 www.detourgold.com Contact Information