


Digital Transformation Strategy PowerPoint Presentation Slides
- 2. Content Value Addition from Transformation Why it is Needed Core Elements Barriers to Digital Transformation Ways to Achieve Digital Transformation Transformation Roadmap Task Distribution Transformation Budget 2
- 3. Why It Is Needed Innovation • Your text here • Your text here Customer Influence • Your text here • Your text here Competition • Your text here • Your text here Employee Influence • Your text here • Your text here 3
- 4. Core Elements 4 Digital Transformation Customer Understanding • Your text here • Your text here Customer Touch Points • Your text here • Your text here Digitally Modified Business • Your text here • Your text here Top – Line Growth • Your text here • Your text here Process Digitization • Your text here • Your text here Performance Management • Your text here • Your text here
- 5. 5 Barriers to Digital Transformation 70% 60% 45% 30% 25% 10% 0% 10% 20% 30% 40% 50% 60% 70% 80% 90% 100% Legacy systems/ processes Digital Skills Shortage Data Issues Short-term Revenue Targets Employee Training Business case Identification This graph/chart is linked to excel, and changes automatically based on data. Just left click on it and select “Edit Data”.
- 6. Ways To Achieve Digital Transformation 6 Gain New Experience & Design Innovative Business Models Adopt New Technologies To an Exiting Infrastructure Co-create & Co- innovation With New Parents Develop Digital DNA Base Decision on Data Not on Feelings 01 02 03 04 05
- 7. Transformation Roadmap Re - Vision Business Cases Opportunity Scan Commitment Test Scale Re – View Re - Cycle Assessment 7
- 8. 8 Task Distribution 80% 0% 10% 20% 30% 40% 50% 60% 70% 80% 90% 100% IT CEO Development Product/ Divisions Research & Development Outside Service Product Special Digital Department Others This graph/chart is linked to excel, and changes automatically based on data. Just left click on it and select “Edit Data”.
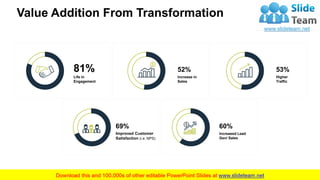
- 9. Value Addition From Transformation Higher Traffic 53% Life in Engagement 81% Increase in Sales 52% Improved Customer Satisfaction (i.e. NPS) 69% Increased Lead Gen/ Sales 60% 9 This graph/chart is linked to excel, and changes automatically based on data. Just left click on it and select “Edit Data”.
- 10. Transformation Budget 0-3 7-244-6 Audience Building Content Curation Months Budget Website & Social Email Database CRM Launch Blog & Email Marketing 10 9500 320007000
- 11. Digital Transformation Strategy Icons Slide 11
- 13. About Us This slide is 100% editable. Adapt it to your needs and capture your audience's attention. Values Client This slide is 100% editable. Adapt it to your needs and capture your audience's attention. Preferred By Many This slide is 100% editable. Adapt it to your needs and capture your audience's attention. Target Audiences 13
- 14. This slide is 100% editable. Adapt it to your needs and capture your audience’s attention. Name Here Designation This slide is 100% editable. Adapt it to your needs and capture your audience’s attention. Name Here Designation Our Team 14
- 15. Our Mission 15 This slide is 100% editable. Adapt it to your needs and capture your audience's attention. This slide is 100% editable. Adapt it to your needs and capture your audience's attention. This slide is 100% editable. Adapt it to your needs and capture your audience's attention. Vision Mission Goal
- 16. Financial 16 This slide is 100% editable. Adapt it to your needs and capture your audience’s attention. 50% This slide is 100% editable. Adapt it to your needs and capture your audience’s attention. 75%
- 17. 17 Financial 5000+ This slide is 100% editable. Adapt it to your needs and capture your audience's attention. Maximum 400+ This slide is 100% editable. Adapt it to your needs and capture your audience's attention. Medium 300+ This slide is 100% editable. Adapt it to your needs and capture your audience's attention. Minimum
- 18. 18 Quotes Our greatest weakness lies in giving up. The most certain way to succeed is always to try just one more time. Thomas Edison
- 19. Timeline 19 2015 2016 2017 2018 2019 This slide is 100% editable. Adapt it to your needs and capture your audience's attention. This slide is 100% editable. Adapt it to your needs and capture your audience's attention. This slide is 100% editable. Adapt it to your needs and capture your audience's attention. This slide is 100% editable. Adapt it to your needs and capture your audience's attention. This slide is 100% editable. Adapt it to your needs and capture your audience's attention.
- 20. Location Brazil Male 60% 80% Female Russia Male 50% 70% Female Australia Male 50% 60% Female Canada Male 40% 60% Female 20
- 21. Area Chart 0 10 20 30 40 50 60 70 80 90 100 FY '12 FY '13 FY '14 FY '15 FY '16 FY '17 FY '18 InPercentage Product 03 Product 02 Product 01 This graph/chart is linked to excel, and changes automatically based on data. Just left click on it and select “Edit Data”. 21
- 22. Combo Chart 22 Profit(InPercentage) 0 10 20 30 40 50 60 70 80 90 100 2016 2017 2018 2019 Product 01 Product 02 Product 03 This graph/chart is linked to excel, and changes automatically based on data. Just left click on it and select “Edit Data”.
- 23. Thanks for Watching ! 23 Home Call Mail Address # street number, city, state Email Address emailaddress@123gmail.com Contact Number 0123456789