Location via proxy:   [ UP ]  
[Report a bug]   [Manage cookies]                
SlideShare a Scribd company logo
Professor: ---____-----
Durham College
Student Name : Ravi Nakulan
ID Number: ------------
Due Date: ------------
Tool Used: Python (Jupyter Notebook)
Assignment No. # 3 – Discriminant Analysis (heartfailure.csv)
Ravi Nakulan 1
Ravi Nakulan 2
Top Rows and Features
Bottom Rows and Features
1. The dataset is heartfailure dataset; meaning to predict
the probability during the medication how many
patients had have survived (alive) or deceased.
2. Dataset has numeric and categorical features (mixed
dataset)
3. It is also imbalanced dataset as our output
DEATH_EVENT has less sample of deceased class than
alive class
4. 0 (Zero) represents the alive class and 1 (One) is for
deceased class.
5. Need to normalize the numerical values because
platelets has large-Magnitude also
creatinine_phosphokinase & serum_creatinine. These
features also has different Units.
6. We will use the base model and then try to create a
data-pipeline to optimize it in order to compare the
best algorithm with the help of confusion matrix
7. We will also recommend other types of algorithm at
the end if our model doesn’t provide any satisfactory
result
Ravi Nakulan 3
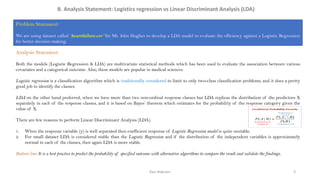
B. Analysis Statement: Logistics regression vs Linear Discriminant Analysis (LDA)
Problem Statement:
We are using dataset called ‘heartfailure.csv’ for Mr. John Hughes to develop a LDA model to evaluate the efficiency against a Logistic Regression
for better decision making.
Analysis Statement:
Both the models (Logistic Regression & LDA) are multivariate statistical methods which has been used to evaluate the association between various
covariates and a categorical outcome. Also, these models are popular in medical sciences.
Logistic regression is a classification algorithm which is traditionally considered to limit to only two-class classification problems, and it does a pretty
good job to identify the classes.
LDA on the other hand preferred, when we have more than two non-ordinal response classes but LDA replicas the distribution of the predictors X
separately in each of the response classes, and it is based on Bayes’ theorem which estimates for the probability of the response category given the
value of X.
There are few reasons to perform Linear Discriminant Analysis (LDA).
1. When the response variable (y) is well separated then coefficient response of Logistic Regression model is quite unstable.
2. For small dataset LDA is considered stable than the Logistic Regression and if the distribution of the independent variables is approximately
normal in each of the classes, then again LDA is more stable.
Bottom line: It is a best practice to predict the probability of specified outcome with alternative algorithms to compare the result and validate the findings.
Ravi Nakulan 4
C. Insight of Pandas Profile Report
Pandas Profile Report is a quick way to do an exploratory data analysis in the form of report after python code.
1. We found there is no missing values in row, neither any duplicate rows.
2. Out of 13 variables: 07 Numerical + 06 Categorical values (Meaning it’s a mixed dataset)
3. Correlation graph represents positive correlationship with variables such as ‘age & serum_creatinine’ and
Negative correlationship with ‘Time, ejection_fraction’ & ‘serum_sodium’ while ’sex & smoking’ does not
show any correlation.
4. Most importantly: The dataset has big numeric values (platelets) and some smaller numeric values (Age, serum
creatinine, creatinine_phosphokinase etc.). So, we need to perform feature-scaling to compute the numerical values
efficiently to get the absolute minimum point.
5. Most of the variables are skewed and we need to perform a standardization (Mean 0 & Stand. Dev. 1) to bring
them in to Gaussian distribution.
6. The categorical data is imbalanced (samples are not equal) including the output variable (DEATH EVENT)
where Alive (0) has 203 samples and Deceased (1) has 96.
Ravi Nakulan 5
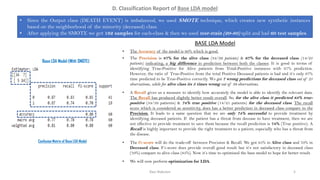
D. Classification Report of Base LDA model
• Since the Output class (DEATH EVENT) is imbalanced, we used SMOTE technique, which creates new synthetic instances
based on the neighborhood of the minority (deceased) class.
• After applying the SMOTE we got 162 samples for each-class & then we used test-train (20-80) split and had 60 test samples.
• The Accuracy of the model is 80% which is good.
• The Precision is 87% for the alive class (34/39 patients) & 67% for the deceased class (14/21
patients) indicating, a big difference in prediction between both the classes. It is good in terms of
identifying True-Positive for Alive patients from Total-Positive instances with 87% prediction.
However, the ratio of True-Positive from the total Positive Deceased patients is bad and it’s only 67%
time predicted to be True-Positive correctly. We got 7 wrong predictions for deceased class out of 21
observations, while for alive class its 5 times wrong out of 39 observations.
• A Recall gives us a measure to identify how accurately the model is able to identify the relevant data.
The Recall has produced slightly better result overall. So, for the alive class it predicted 83% true-
positive (34/39 patients) & 74% true positive (14/21 patients) for the deceased class. The recall
score which is considered as sensitivity, does has a better prediction in deceased class compare to the
Precision. It leads to a same question that we are only 74% successful to provide treatment by
identifying deceased patients. If the patient has a threat from decease to have treatment, then we are
not effective to provide treatment to save them because the recall prediction is 74% (True positive). A
Recall is highly important to provide the right treatment to a patient, especially who has a threat from
the disease.
• The f1-score will do the trade-off between Precision & Recall. We got 85% in Alive class and 70% in
Deceased class. F1-score does provide overall good result but it’s not satisfactory in deceased class
(70%) compare to alive class (85%). Now it’s time to optimized the base model to hope for better result.
• We will now perform optimization for LDA.
BASE LDA Model
Base LDA Model (With SMOTE)
Confusion Matrix of Base LDA Model
Ravi Nakulan 6
• The Accuracy of the optimized model is 80% which is same as the base LDA model.
• There has been no changes in Precision score after the optimization. The Precision is 87% for the
alive class (34/39 patients) & 67% for the deceased class (14/21 patients) indicating, a big difference in
prediction for both the classes. It is good in terms of identifying True Positive for Alive patients from
Total Positive instances with 87% prediction. However, the ratio of True-positive from the total
deceased-positive patients, is too bad and it’s only 67% time predicted to be True correctly. The
Precision prediction is only 1% less than the Logistic Regression prediction (88%). We got 7 wrong
predictions for deceased case out of 21 observations, while for alive case its 5 times wrong out of 39
observations.
• The Recall score is also the same as the basic LDA model after the optimization. Recall gives us a
measure to identify how accurately the model is able to identify the relevant data. The Recall has
produced slightly better result overall. So, for the alive class it predicted 83% true-positive (34/39
patients) & 74% true positive (14/21 patients) for the deceased class. The recall score which is
considered as sensitivity, does has a better prediction in deceased class compare to the Precision but
exactly the same as Logistic Regression. It leads to a same question that we are only 74% successful
to provide treatment by identifying deceased patients. If the patient has a threat to decease, then we are
not effective to provide treatment to save them because the recall prediction is 74% (True positive). A
Recall is highly important to provide the right treatment to a patient who has a threat against the
disease.
• Since the Precision and Recall produced the same result as base LDA model the f1-score is as same as
the base LDA model. After the trade-off between Precision & Recall we got 85% in Alive class and
70% in Deceased class. F1-score does provide overall good result but it’s not satisfactory in deceased
class (70%) compare to alive class (85%). Now it’s time to optimized the base model to hope for better
result.
• We will now move to LDA confusion-matrix and compare it with Logistic Regression.
Optimized LDA Model
Optimized LDA Model (With SMOTE)
D. Classification Report of Optimized LDA model
Confusion Matrix of Optimized LDA Model
Base LDA Model (With SMOTE)
Optimized LDA Model (With SMOTE)
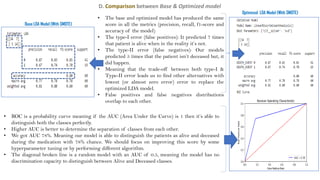
D. Comparison between Base & Optimized model
• The base and optimized model has produced the same
score in all the metrics (precision, recall, f1-score and
accuracy of the model)
• The type-I error (false positives): It predicted 7 times
that patient is alive when in the reality it’s not.
• The type-II error (false negatives): Our models
predicted 5 times that the patient isn’t deceased but, it
did happen.
• Meaning that the trade-off between both type-I &
Type-II error leads us to find other alternatives with
lowest (or almost zero error) error to replace the
optimized LDA model.
• False positives and false negatives distributions
overlap to each other.
• ROC is a probability curve meaning if the AUC (Area Under the Curve) is 1 then it’s able to
distinguish both the classes perfectly.
• Higher AUC is better to determine the separation of classes from each other.
• We got AUC 78%. Meaning our model is able to distinguish the patients as alive and deceased
during the medication with 78% chance. We should focus on improving this score by some
hyperparameter tuning or by performing different algorithm.
• The diagonal broken line is a random model with an AUC of 0.5, meaning the model has no
discrimination capacity to distinguish between Alive and Deceased classes.
Ravi Nakulan 8
E. Comparison: Optimized LDA model Vs Optimized Linear Regression
• The overall Accuracy of the optimized Logistic Regression model is 83% which is good.
• Precision helps us to understand ratio between the True-Positives and all the Positives Cases. The
Precision is 88% for the Alive Class (36/41 patients) & 74% for the Deceased Class (14/19 patients)
indicating that it is good but not as good as per medical industry standards. Meaning, 88% of patients
identified correctly as Alive (True positive) from Total-Positives. While 74% is the ratio of True-
Positive from the total Deceased-Positive patients. So, the prediction of being Alive is 88% time
correct during the medication than 74% time in Deceased patient class. Meaning the prediction is
not the best because we could increase this prediction in both classes to find it as true-positives. we got 5
wrong predictions for deceased case out of 19 observations, while for alive case its again 5 times wrong
but out of 41 observations.
• Recall helps us understand to identify True positives meaning the Truth. The Recall has produced
exactly the same result for the Alive Class (36/41 patients) & (14/19 patients) for the Deceased Class
as Precision did. However, Recall indicates the measure of correctly identifying the true positives. It leads to a
question that we are only 74% successful to provide the treatment by identifying Deceased patients
during the medication. If the patient has a threat to decease, then we are not effective to provide
treatment to save them because the Recall prediction is 74% (True positive) only. A Recall is highly
important to provide the right treatment to a patient who has a threat against the disease.
• f1-score is a trade off between Precision & Recall, meaning f1-score is the harmonic mean of
Precision and Recall and since our Precision & Recall scores are the same; our f1-score is also the
same (88% true positive for Alive & 74% True positive for deceased). In some medical cases,
Precision & Recall can be equally important & therefore looking at f1-score is the best bet to know the
model's overall performance.
• We will now move to compare our Optimized Logistic Regression model with Optimized LDA model
Optimized Logistic Regression
• The Optimized Logistic Regression with SMOTE has been provided already to have a comparison with Optimized LDA model.
Optimized Model (With SMOTE)
Confusion Matrix of Logistic Regression
E. Comparison: Optimized LDA model Vs Optimized Linear Regression
• The Accuracy of the optimized Logistic Regression model is 83% while the LDA is 80% only. Meaning the
Accuracy have been produced by Logistic Regression is 3% better but needs to look at other parameters.
• Precision helps us to understand ratio between the True-Positives and all the Positives Cases. Here the
Precision for Logistic Regression comes as 88% for the Alive Class (True-Positive) which is slightly better
than 87% in LDA. Though this difference is just a textbook difference. Precision of the Deceased Class
for Logistic Regression comes as 74% (True Positive), while it is 67% time predicted to be True-positive
by the LDA model, which isn’t satisfactory. Meaning, Logistic Regression has done great job than LDA
in the Deceased Class. Winner is Logistic Regression for the Precision.
• Recall helps us understand to identify True positives meaning the Truth. The Recall has produced exactly the
same result as 88% for the Alive Class (36/41 patients) by Logistic Regression and 83% by the LDA model.
Meaning Logistic Regression has done better job to identify true incident by increasing the chane to 88% for
Alive class.
• In the Deceased class Logistic Regression has produced the same result as Precision did with 74% chance of
prediction, while by the LDA model it also produced the same result as 74% for Deceased class. Here, they both
have the same result (74%), which may have concern for Mr. John Hughes because in the medical filed it is
important to protect the patient from adversity of diseases, where recall becomes priority in some cases
because recall is imperative to provide the right treatment to patient who has a threat from the disease.
• Moving to f1-score which is a trade off between Precision & Recall, and clearly the Optimized Logistic
Regression has done better job in Alive class with 88% and 74% in Deceased class, comparing with
Optimized LDA where the Alive class prediction is 85% and 70% for the Deceased class. Meaning, f1-score
the harmonized mean of precision & recall indicates that Logistic Regression able to predict better result.
• The differences are not significantly high between both the models, however the Precision prediction in
Deceased class has quite high prediction difference between the both models. Therefore, Optimized Logistic
Regression is a better choice than Optimized LDA model.
Comparison of Optimized LDA & Optimized Logistic Regression models
Optimized Logistic Regression Classification Report
Optimized LDA Classification Report - Key insights are in the next slide -
with SMOTE
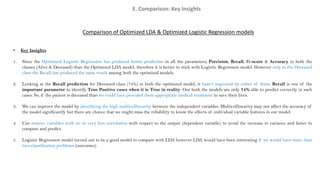
E. Comparison: Key Insights
• Key Insights
1. Since the Optimized Logistic Regression has produced better prediction in all the parameters, Precision, Recall, f1-score & Accuracy in both the
classes (Alive & Deceased) than the Optimized LDA model, therefore it is better to stick with Logistic Regression model. However only in the Deceased
class the Recall has produced the same result among both the optimized models.
2. Looking at the Recall prediction for Deceased class (74%) in both the optimized model, it hasn’t improved by either of them. Recall is one of the
important parameter to identify True Positive cases when it is True in reality. Our both the models are only 74% able to predict correctly in such
cases. So, if the patient is deceased than we could have provided them appropriate medical treatment to save their lives.
3. We can improve the model by identifying the high multicollinearity between the independent variables. Multicollinearity may not affect the accuracy of
the model significantly but there are chance that we might miss the reliability to know the effects of individual variable features in our model.
4. Can remove variables with no or very less correlation with respect to the output (dependent variable) to avoid the increase in variance and faster to
compute and predict.
5. Logistic Regression model turned out to be a good model to compare with LDA however LDA would have been interesting if we would have more than
two-classification problems (outcomes).
Comparison of Optimized LDA & Optimized Logistic Regression models
Ravi Nakulan 11
• Few Recommendations for Mr. John Hughes.
1. Both the models (Logistic Regression and LDA) are multivariate statistical methods which can determine the association between several covariates and
categorical outcome (deceased or alive). Since both the models have produced almost same results (significantly little difference in outcomes), it is
recommended to get more independent features (x) in the dataset. Additional features will certainly help to determine the effect of them in the outcome.
Notably, we have used SMOTE which bring our attention to that we did not have enough samples for the Deceased class, and thus we used sampling
technique. This is another issue with the model that we did not have enough number of samples. Realistically, we would have a smaller number of
records on Deceased Class samples but if we could narrow the gap between both classes, so that we can use other sampling techniques (oversampling)
to evaluate our model with Optimized Logistic Regression and Optimized LDA model.
2. Since the LDA does not provide any good result than Logistic regression, we can also perform QDA (Quadratic Discriminant Analysis). QDA serves as
a compromise between the non-parametric kNN method and the linear LDA and Logistics regression approaches. As name suggest, QDA assumes a
quadratic decision boundary and it can accurately model a wider range of problems than let alone can the linear methods. Because it assumes that each
class has its own covariance matrix. Also, it is useful and effective in the presence of a limited number of training observations which is exactly happen
in our case (Deceased Class). As it does make some assumptions about the form of the decision boundary.
3. Instead of Linear Algorithms we should use Non-Linear Algorithms because we have found that both the classes overlapping, and we need proper
separation. We can take a look at Decision Trees as it is a cost-sensitive algorithm and can be effective since we are using imbalanced dataset. Decision
Tree work on hierarchy of if/else based questions from the root note till the end of pure leaf node. We can use Entropy (0 to 1), Gini impurity (0 to 0.5) to
calculate the information gain (IG), as they are the measures of impurity of a node.
F. Recommendations for Mr. John Hughes
Reference from Class notes in Week 5: Professor Sam Plati
Thank You
Ravi
Nakulan
12
All the references are taken from our class-lecture notes provided by the Professor of Statistical
Prediction Modeling.

More Related Content

Discriminant analysis ravi nakulan slideshare

  • 1. Professor: ---____----- Durham College Student Name : Ravi Nakulan ID Number: ------------ Due Date: ------------ Tool Used: Python (Jupyter Notebook) Assignment No. # 3 – Discriminant Analysis (heartfailure.csv) Ravi Nakulan 1
  • 2. Ravi Nakulan 2 Top Rows and Features Bottom Rows and Features 1. The dataset is heartfailure dataset; meaning to predict the probability during the medication how many patients had have survived (alive) or deceased. 2. Dataset has numeric and categorical features (mixed dataset) 3. It is also imbalanced dataset as our output DEATH_EVENT has less sample of deceased class than alive class 4. 0 (Zero) represents the alive class and 1 (One) is for deceased class. 5. Need to normalize the numerical values because platelets has large-Magnitude also creatinine_phosphokinase & serum_creatinine. These features also has different Units. 6. We will use the base model and then try to create a data-pipeline to optimize it in order to compare the best algorithm with the help of confusion matrix 7. We will also recommend other types of algorithm at the end if our model doesn’t provide any satisfactory result
  • 3. Ravi Nakulan 3 B. Analysis Statement: Logistics regression vs Linear Discriminant Analysis (LDA) Problem Statement: We are using dataset called ‘heartfailure.csv’ for Mr. John Hughes to develop a LDA model to evaluate the efficiency against a Logistic Regression for better decision making. Analysis Statement: Both the models (Logistic Regression & LDA) are multivariate statistical methods which has been used to evaluate the association between various covariates and a categorical outcome. Also, these models are popular in medical sciences. Logistic regression is a classification algorithm which is traditionally considered to limit to only two-class classification problems, and it does a pretty good job to identify the classes. LDA on the other hand preferred, when we have more than two non-ordinal response classes but LDA replicas the distribution of the predictors X separately in each of the response classes, and it is based on Bayes’ theorem which estimates for the probability of the response category given the value of X. There are few reasons to perform Linear Discriminant Analysis (LDA). 1. When the response variable (y) is well separated then coefficient response of Logistic Regression model is quite unstable. 2. For small dataset LDA is considered stable than the Logistic Regression and if the distribution of the independent variables is approximately normal in each of the classes, then again LDA is more stable. Bottom line: It is a best practice to predict the probability of specified outcome with alternative algorithms to compare the result and validate the findings.
  • 4. Ravi Nakulan 4 C. Insight of Pandas Profile Report Pandas Profile Report is a quick way to do an exploratory data analysis in the form of report after python code. 1. We found there is no missing values in row, neither any duplicate rows. 2. Out of 13 variables: 07 Numerical + 06 Categorical values (Meaning it’s a mixed dataset) 3. Correlation graph represents positive correlationship with variables such as ‘age & serum_creatinine’ and Negative correlationship with ‘Time, ejection_fraction’ & ‘serum_sodium’ while ’sex & smoking’ does not show any correlation. 4. Most importantly: The dataset has big numeric values (platelets) and some smaller numeric values (Age, serum creatinine, creatinine_phosphokinase etc.). So, we need to perform feature-scaling to compute the numerical values efficiently to get the absolute minimum point. 5. Most of the variables are skewed and we need to perform a standardization (Mean 0 & Stand. Dev. 1) to bring them in to Gaussian distribution. 6. The categorical data is imbalanced (samples are not equal) including the output variable (DEATH EVENT) where Alive (0) has 203 samples and Deceased (1) has 96.
  • 5. Ravi Nakulan 5 D. Classification Report of Base LDA model • Since the Output class (DEATH EVENT) is imbalanced, we used SMOTE technique, which creates new synthetic instances based on the neighborhood of the minority (deceased) class. • After applying the SMOTE we got 162 samples for each-class & then we used test-train (20-80) split and had 60 test samples. • The Accuracy of the model is 80% which is good. • The Precision is 87% for the alive class (34/39 patients) & 67% for the deceased class (14/21 patients) indicating, a big difference in prediction between both the classes. It is good in terms of identifying True-Positive for Alive patients from Total-Positive instances with 87% prediction. However, the ratio of True-Positive from the total Positive Deceased patients is bad and it’s only 67% time predicted to be True-Positive correctly. We got 7 wrong predictions for deceased class out of 21 observations, while for alive class its 5 times wrong out of 39 observations. • A Recall gives us a measure to identify how accurately the model is able to identify the relevant data. The Recall has produced slightly better result overall. So, for the alive class it predicted 83% true- positive (34/39 patients) & 74% true positive (14/21 patients) for the deceased class. The recall score which is considered as sensitivity, does has a better prediction in deceased class compare to the Precision. It leads to a same question that we are only 74% successful to provide treatment by identifying deceased patients. If the patient has a threat from decease to have treatment, then we are not effective to provide treatment to save them because the recall prediction is 74% (True positive). A Recall is highly important to provide the right treatment to a patient, especially who has a threat from the disease. • The f1-score will do the trade-off between Precision & Recall. We got 85% in Alive class and 70% in Deceased class. F1-score does provide overall good result but it’s not satisfactory in deceased class (70%) compare to alive class (85%). Now it’s time to optimized the base model to hope for better result. • We will now perform optimization for LDA. BASE LDA Model Base LDA Model (With SMOTE) Confusion Matrix of Base LDA Model
  • 6. Ravi Nakulan 6 • The Accuracy of the optimized model is 80% which is same as the base LDA model. • There has been no changes in Precision score after the optimization. The Precision is 87% for the alive class (34/39 patients) & 67% for the deceased class (14/21 patients) indicating, a big difference in prediction for both the classes. It is good in terms of identifying True Positive for Alive patients from Total Positive instances with 87% prediction. However, the ratio of True-positive from the total deceased-positive patients, is too bad and it’s only 67% time predicted to be True correctly. The Precision prediction is only 1% less than the Logistic Regression prediction (88%). We got 7 wrong predictions for deceased case out of 21 observations, while for alive case its 5 times wrong out of 39 observations. • The Recall score is also the same as the basic LDA model after the optimization. Recall gives us a measure to identify how accurately the model is able to identify the relevant data. The Recall has produced slightly better result overall. So, for the alive class it predicted 83% true-positive (34/39 patients) & 74% true positive (14/21 patients) for the deceased class. The recall score which is considered as sensitivity, does has a better prediction in deceased class compare to the Precision but exactly the same as Logistic Regression. It leads to a same question that we are only 74% successful to provide treatment by identifying deceased patients. If the patient has a threat to decease, then we are not effective to provide treatment to save them because the recall prediction is 74% (True positive). A Recall is highly important to provide the right treatment to a patient who has a threat against the disease. • Since the Precision and Recall produced the same result as base LDA model the f1-score is as same as the base LDA model. After the trade-off between Precision & Recall we got 85% in Alive class and 70% in Deceased class. F1-score does provide overall good result but it’s not satisfactory in deceased class (70%) compare to alive class (85%). Now it’s time to optimized the base model to hope for better result. • We will now move to LDA confusion-matrix and compare it with Logistic Regression. Optimized LDA Model Optimized LDA Model (With SMOTE) D. Classification Report of Optimized LDA model Confusion Matrix of Optimized LDA Model
  • 7. Base LDA Model (With SMOTE) Optimized LDA Model (With SMOTE) D. Comparison between Base & Optimized model • The base and optimized model has produced the same score in all the metrics (precision, recall, f1-score and accuracy of the model) • The type-I error (false positives): It predicted 7 times that patient is alive when in the reality it’s not. • The type-II error (false negatives): Our models predicted 5 times that the patient isn’t deceased but, it did happen. • Meaning that the trade-off between both type-I & Type-II error leads us to find other alternatives with lowest (or almost zero error) error to replace the optimized LDA model. • False positives and false negatives distributions overlap to each other. • ROC is a probability curve meaning if the AUC (Area Under the Curve) is 1 then it’s able to distinguish both the classes perfectly. • Higher AUC is better to determine the separation of classes from each other. • We got AUC 78%. Meaning our model is able to distinguish the patients as alive and deceased during the medication with 78% chance. We should focus on improving this score by some hyperparameter tuning or by performing different algorithm. • The diagonal broken line is a random model with an AUC of 0.5, meaning the model has no discrimination capacity to distinguish between Alive and Deceased classes.
  • 8. Ravi Nakulan 8 E. Comparison: Optimized LDA model Vs Optimized Linear Regression • The overall Accuracy of the optimized Logistic Regression model is 83% which is good. • Precision helps us to understand ratio between the True-Positives and all the Positives Cases. The Precision is 88% for the Alive Class (36/41 patients) & 74% for the Deceased Class (14/19 patients) indicating that it is good but not as good as per medical industry standards. Meaning, 88% of patients identified correctly as Alive (True positive) from Total-Positives. While 74% is the ratio of True- Positive from the total Deceased-Positive patients. So, the prediction of being Alive is 88% time correct during the medication than 74% time in Deceased patient class. Meaning the prediction is not the best because we could increase this prediction in both classes to find it as true-positives. we got 5 wrong predictions for deceased case out of 19 observations, while for alive case its again 5 times wrong but out of 41 observations. • Recall helps us understand to identify True positives meaning the Truth. The Recall has produced exactly the same result for the Alive Class (36/41 patients) & (14/19 patients) for the Deceased Class as Precision did. However, Recall indicates the measure of correctly identifying the true positives. It leads to a question that we are only 74% successful to provide the treatment by identifying Deceased patients during the medication. If the patient has a threat to decease, then we are not effective to provide treatment to save them because the Recall prediction is 74% (True positive) only. A Recall is highly important to provide the right treatment to a patient who has a threat against the disease. • f1-score is a trade off between Precision & Recall, meaning f1-score is the harmonic mean of Precision and Recall and since our Precision & Recall scores are the same; our f1-score is also the same (88% true positive for Alive & 74% True positive for deceased). In some medical cases, Precision & Recall can be equally important & therefore looking at f1-score is the best bet to know the model's overall performance. • We will now move to compare our Optimized Logistic Regression model with Optimized LDA model Optimized Logistic Regression • The Optimized Logistic Regression with SMOTE has been provided already to have a comparison with Optimized LDA model. Optimized Model (With SMOTE) Confusion Matrix of Logistic Regression
  • 9. E. Comparison: Optimized LDA model Vs Optimized Linear Regression • The Accuracy of the optimized Logistic Regression model is 83% while the LDA is 80% only. Meaning the Accuracy have been produced by Logistic Regression is 3% better but needs to look at other parameters. • Precision helps us to understand ratio between the True-Positives and all the Positives Cases. Here the Precision for Logistic Regression comes as 88% for the Alive Class (True-Positive) which is slightly better than 87% in LDA. Though this difference is just a textbook difference. Precision of the Deceased Class for Logistic Regression comes as 74% (True Positive), while it is 67% time predicted to be True-positive by the LDA model, which isn’t satisfactory. Meaning, Logistic Regression has done great job than LDA in the Deceased Class. Winner is Logistic Regression for the Precision. • Recall helps us understand to identify True positives meaning the Truth. The Recall has produced exactly the same result as 88% for the Alive Class (36/41 patients) by Logistic Regression and 83% by the LDA model. Meaning Logistic Regression has done better job to identify true incident by increasing the chane to 88% for Alive class. • In the Deceased class Logistic Regression has produced the same result as Precision did with 74% chance of prediction, while by the LDA model it also produced the same result as 74% for Deceased class. Here, they both have the same result (74%), which may have concern for Mr. John Hughes because in the medical filed it is important to protect the patient from adversity of diseases, where recall becomes priority in some cases because recall is imperative to provide the right treatment to patient who has a threat from the disease. • Moving to f1-score which is a trade off between Precision & Recall, and clearly the Optimized Logistic Regression has done better job in Alive class with 88% and 74% in Deceased class, comparing with Optimized LDA where the Alive class prediction is 85% and 70% for the Deceased class. Meaning, f1-score the harmonized mean of precision & recall indicates that Logistic Regression able to predict better result. • The differences are not significantly high between both the models, however the Precision prediction in Deceased class has quite high prediction difference between the both models. Therefore, Optimized Logistic Regression is a better choice than Optimized LDA model. Comparison of Optimized LDA & Optimized Logistic Regression models Optimized Logistic Regression Classification Report Optimized LDA Classification Report - Key insights are in the next slide - with SMOTE
  • 10. E. Comparison: Key Insights • Key Insights 1. Since the Optimized Logistic Regression has produced better prediction in all the parameters, Precision, Recall, f1-score & Accuracy in both the classes (Alive & Deceased) than the Optimized LDA model, therefore it is better to stick with Logistic Regression model. However only in the Deceased class the Recall has produced the same result among both the optimized models. 2. Looking at the Recall prediction for Deceased class (74%) in both the optimized model, it hasn’t improved by either of them. Recall is one of the important parameter to identify True Positive cases when it is True in reality. Our both the models are only 74% able to predict correctly in such cases. So, if the patient is deceased than we could have provided them appropriate medical treatment to save their lives. 3. We can improve the model by identifying the high multicollinearity between the independent variables. Multicollinearity may not affect the accuracy of the model significantly but there are chance that we might miss the reliability to know the effects of individual variable features in our model. 4. Can remove variables with no or very less correlation with respect to the output (dependent variable) to avoid the increase in variance and faster to compute and predict. 5. Logistic Regression model turned out to be a good model to compare with LDA however LDA would have been interesting if we would have more than two-classification problems (outcomes). Comparison of Optimized LDA & Optimized Logistic Regression models
  • 11. Ravi Nakulan 11 • Few Recommendations for Mr. John Hughes. 1. Both the models (Logistic Regression and LDA) are multivariate statistical methods which can determine the association between several covariates and categorical outcome (deceased or alive). Since both the models have produced almost same results (significantly little difference in outcomes), it is recommended to get more independent features (x) in the dataset. Additional features will certainly help to determine the effect of them in the outcome. Notably, we have used SMOTE which bring our attention to that we did not have enough samples for the Deceased class, and thus we used sampling technique. This is another issue with the model that we did not have enough number of samples. Realistically, we would have a smaller number of records on Deceased Class samples but if we could narrow the gap between both classes, so that we can use other sampling techniques (oversampling) to evaluate our model with Optimized Logistic Regression and Optimized LDA model. 2. Since the LDA does not provide any good result than Logistic regression, we can also perform QDA (Quadratic Discriminant Analysis). QDA serves as a compromise between the non-parametric kNN method and the linear LDA and Logistics regression approaches. As name suggest, QDA assumes a quadratic decision boundary and it can accurately model a wider range of problems than let alone can the linear methods. Because it assumes that each class has its own covariance matrix. Also, it is useful and effective in the presence of a limited number of training observations which is exactly happen in our case (Deceased Class). As it does make some assumptions about the form of the decision boundary. 3. Instead of Linear Algorithms we should use Non-Linear Algorithms because we have found that both the classes overlapping, and we need proper separation. We can take a look at Decision Trees as it is a cost-sensitive algorithm and can be effective since we are using imbalanced dataset. Decision Tree work on hierarchy of if/else based questions from the root note till the end of pure leaf node. We can use Entropy (0 to 1), Gini impurity (0 to 0.5) to calculate the information gain (IG), as they are the measures of impurity of a node. F. Recommendations for Mr. John Hughes Reference from Class notes in Week 5: Professor Sam Plati
  • 12. Thank You Ravi Nakulan 12 All the references are taken from our class-lecture notes provided by the Professor of Statistical Prediction Modeling.