


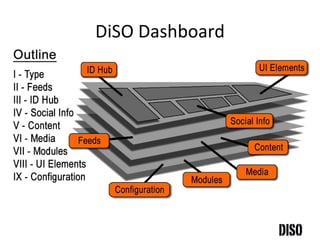
DiSo Dashboard Outline
- 1. Outline format for DiSO Dashboards A format to tie the distributed web together
- 2. Current focus of DiSO Find agreement on Activity stream feed formats Verbs and Objects Atom media extensions Most major platforms lining up
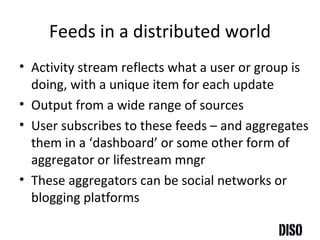
- 3. Feeds in a distributed world Activity stream reflects what a user or group is doing, with a unique item for each update Output from a wide range of sources User subscribes to these feeds – and aggregates them in a ‘dashboard’ or some other form of aggregator or lifestream mngr These aggregators can be social networks or blogging platforms
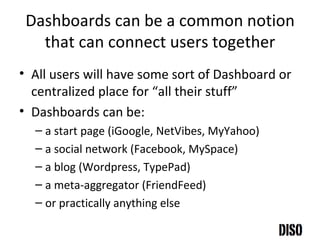
- 4. Dashboards can be a common notion that can connect users together All users will have some sort of Dashboard or centralized place for “all their stuff” Dashboards can be: a start page (iGoogle, NetVibes, MyYahoo) a social network (Facebook, MySpace) a blog (Wordpress, TypePad) a meta-aggregator (FriendFeed) or practically anything else
- 5. Dashboards can represent…. An Individual A Group An Enterprise An NGO or other kind of org or even a government agency But it’s clearly a node in the user’s distributed web Which can be used as a mechanism for collecting and sharing in the distributed web
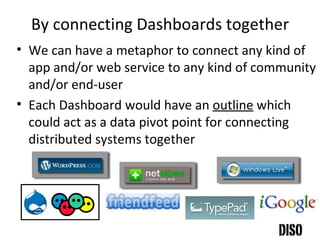
- 6. By connecting Dashboards together We can have a metaphor to connect any kind of app and/or web service to any kind of community and/or end-user Each Dashboard would have an outline which could act as a data pivot point for connecting distributed systems together
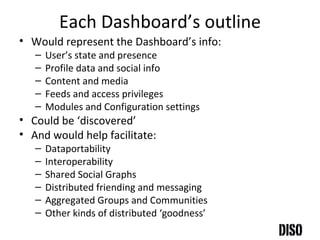
- 7. Each Dashboard’s outline Would represent the Dashboard’s info: User’s state and presence Profile data and social info Content and media Feeds and access privileges Modules and Configuration settings Could be ‘discovered’ And would help facilitate: Dataportability Interoperability Shared Social Graphs Distributed friending and messaging Aggregated Groups and Communities Other kinds of distributed ‘goodness’
- 8. Outline format – the beginning Type of Dashboard Feeds Subscriptions Access privileges to those Feeds who gets ‘access to what’ in the feeds the Dashboard’s access privs would regulate access to data objects, people, web pages or practically anything else – controlled by the user sort of like Facebook Connect for us all
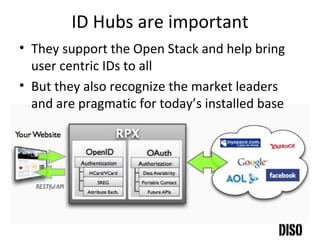
- 9. Outline format – and an ID Hub JanRain is offering something, which we (BBM) started building with PeopleAggregator A collection of ID technologies called an ID Hub ID Hubs would support both open and proprietary ID systems – and connect them together
- 10. ID Hubs are important They support the Open Stack and help bring user centric IDs to all But they also recognize the market leaders and are pragmatic for today’s installed base
- 11. So every Dashboard will store a user’s ID Hub ID Hubs should be a part of the Dashboard’s outline Each ID system would be kept track of And an aggregated social graph would be developed
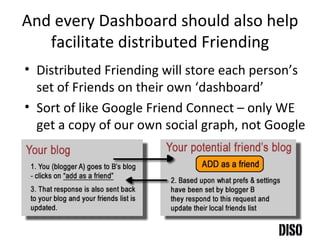
- 12. And every Dashboard should also help facilitate distributed Friending Distributed Friending will store each person’s set of Friends on their own ‘dashboard’ Sort of like Google Friend Connect – only WE get a copy of our own social graph, not Google
- 13. 4 different buttons, same technology Distributed Friending can facilitate different kinds of social relationships, at the same time
- 14. Outline format – and Social info A full range of Social info would be stored in the Dashboard’s Outline In addition to distributed friending What Groups or Networks they’re a member of What their Favs are What their Bookmarks are All sorts of info about the user and other people
- 15. Outline format – and Content All of the User’s Content would be represented in their Dashboard’s Outline All kinds of text posts, notes, Twits and Messages Comments Reviews and Events Testimonials and Shoutouts Connected to the Dashboard’s Access controls
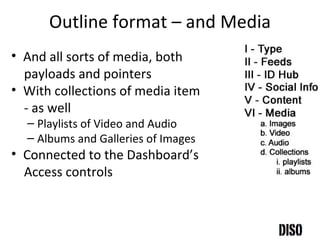
- 16. Outline format – and Media And all sorts of media, both payloads and pointers With collections of media item - as well Playlists of Video and Audio Albums and Galleries of Images Connected to the Dashboard’s Access controls
- 17. Outline format – Modules & Widgets The Dashboard’s Outline would also represent what modules, widgets and code were present What Flash and Ajax/Javascript Widgets are included What platform specific ‘Gadgets’ What OpenSocial Apps and Facebook apps What code segments, Java apps, ActiveX controls
- 18. Outline format – UI Elements And what UI Elements were ‘ surfaced’ to the users All of the Elements which make up the Dashboard’s UI
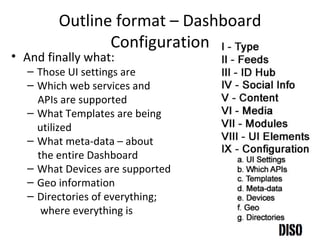
- 19. Outline format – Dashboard Configuration And finally what: Those UI settings are Which web services and APIs are supported What Templates are being utilized What meta-data – about the entire Dashboard What Devices are supported Geo information Directories of everything; where everything is
- 20. All in one Outline By combining all of this distributed data – in one outline, a wide range of inter-connectivity can be facilitated – with one format The outline serves as an aggregation of standard info – accessible the same way across a wide range of dashboards Not necessarily a file or page tags (maybe both) Can/should be OPML and XOXO compatible too! And created/edited in a new kind of tool
- 21. DiSO Dashboard