Does the EU Emission Trading Scheme ETS Promote Energy Efficiency?
•
0 likes•507 views

This policy brief analyzes the main interacting mechanisms between the Energy Efficiency Directive (EED) and the EU Emission Trading Scheme (ETS). It presents a detailed top-down approach, based on the ODYSSEE energy indicators, to identify energy savings from the EU ETS. The main task consists in isolating those factors that contribute to the change in energy consumption of industrial branches covered by the EU ETS, and the energy transformation sector (mainly the electricity sector). Speaker: Wolfgang Eichhammer (Head of the Competence Center Energy Policy and Energy Markets @Fraunhofer Institute for Systems and Innovation Research ISI) The recordings of this webinar can be watched via: https://youtu.be/TS6PxIvtaKY
Report
Share


Does the EU Emission Trading Scheme ETS Promote Energy Efficiency?
- 2. Does the EU Emission Trading Scheme ETS Promote Energy Efficiency ? 12 October 2021 Wolfgang Eichhammer, Fraunhofer Institute for Systems and Innovation Research ISI
- 3. The Fraunhofer-Gesellschaft at a Glance The Fraunhofer-Gesellschaft undertakes applied research of direct utility to private and public enterprise and of wide benefit to society. 29,000 staff More than 70% is derived from contracts with industry and from publicly financed research projects. Almost 30% is contributed by the German federal and states Governments Finance volume €2.8 billion 2020 Contract Research €2.4 billion Major infrastructure capital expenditure and defense research 75 institutes and research units
- 4. Key Questions ▪ Through which mechanisms does the EU Emission Trading Scheme ETS promote energy savings? ▪ How can we identify energy savings from the EU ETS through top-down indicators as provided by ODYSSEE? ▪ Is there quantitative evidence that the EU ETS promotes energy efficiency? Presentation and policy brief discusses, based on the Odyssee and MURE databases (www.odyssee-mure.eu), through the use of energy efficiency indicators how the EU ETS may have promoted energy efficiency progress in the EU in the period 2005-2019/2020.
- 6. © Fraunhofer Phases of the EU ETS 2005-2020 Phase I Phase II Phase III Phase IV 2005-7 Historical emissions (grandfathering) 2008-12 Historical emissions (grandfathering) 10% auctioning 2013-20 Auctioning energy sector (60%) Benchmarking industry sector: 54 product benchmarks +fallback (40%) cut in emissions volume 6.5% below 2005 level Single EU-wide cap, 1.74% cap reduction every year (-21% by 2020 below 2005 level) (Domestic) Aviation New industries (Chemicals, Non-ferrous New gases (N20, CH4) Market Stability Reserve MSR ETS Auction Revenue for innovative low-carbon processes (NER 300) 2021-30 Ambition / Innovation / Integrity Enhanced GhG targets (-55% by 2030): strong link between general targets and EU ETS cap Penalty 100 €/t CO2) Penalty 40 €/t CO2) From 2.2 to 4.2% annual cap reduction New sectors: maritime, buildings/transport, enhancement aviation CDM/CERs Carbon border adjustment mechanism (CBAM) Strengthened Market Stability Reserve End of CDM/CERs Strengthened Benchmarks and faster phase-out of free allocation Spur Innovation
- 7. © Fraunhofer Seite 7 Evolution of the EU ETS allowance price Source: Sandbag, https://sandbag.be/index.php/carbon-price-viewer/ https://www.euractiv.com/section/emissions-trading-scheme/interview/analyst-eu-carbon- price-on-track-to-reach-e90-by-2030/ Phase II Phase III Phase IV low prices due to: ▪ Oversupply from Clean Development Mechanism CDM ▪ Economic/financial crises 2008/2009 ▪ Oversupply of one annual emission budget rising prices due to: ▪ Market Stability Reserve MSR ▪ Perspective of Phase IV strongly rising prices due to: ▪ Climate neutrality target ▪ 55% GHG target and corresponding reduction in ETS cap (from 2.2% to 4.2% annual decrease)
- 8. Energy Efficiency Impacts of the EU ETS in the Industrial Sector 1. Fuel efficiency improvements in industry branches concerned by the EU ETS; 2. Electricity efficiency improvements in ALL industrial branches, including non- ETS industries, due to the integration of CO2 prices into electricity prices; 3. Enhanced fuel shift towards less CO2-intensive fuels in the industrial sector: more natural gas and electricity; increased penetration of renewables in ETS- Industries; 4. Reduction in production volumes (due to the shift of production volumes outside Europe).
- 9. Energy Efficiency Impacts of the EU ETS in the Energy Sector 5. Energy efficiency improvement in thermal electricity generation by fuel (natural gas, coal, oil…); 6. Enhanced penetration of more efficient power plants: more efficient fossil power plants (in particular gas plants), enhanced penetration of renewables into electricity generation; 7. Reduction in the demand for electricity across ALL sectors due to the integration of CO2 prices in into electricity prices; 8. Change in the dispatch of power plants. This implies that less carbon intensive fuels such as natural gas or renewables are used more intensively in the daily dispatch of power plants compared to oil and coal.
- 10. Energy Efficiency Impacts of the EU ETS in the Aviation Sector 9. Energy efficiency improvement in fuel consumption for aviation 10. Modal shift from (domestic) air traffic towards less CO2-intensive transport modes
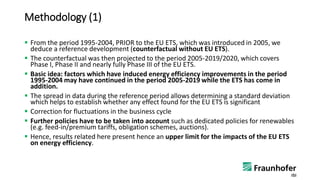
- 11. Methodology (1) ▪ From the period 1995-2004, PRIOR to the EU ETS, which was introduced in 2005, we deduce a reference development (counterfactual without EU ETS). ▪ The counterfactual was then projected to the period 2005-2019/2020, which covers Phase I, Phase II and nearly fully Phase III of the EU ETS. ▪ Basic idea: factors which have induced energy efficiency improvements in the period 1995-2004 may have continued in the period 2005-2019 while the ETS has come in addition. ▪ The spread in data during the reference period allows determining a standard deviation which helps to establish whether any effect found for the EU ETS is significant ▪ Correction for fluctuations in the business cycle ▪ Further policies have to be taken into account such as dedicated policies for renewables (e.g. feed-in/premium tariffs, obligation schemes, auctions). ▪ Hence, results related here present hence an upper limit for the impacts of the EU ETS on energy efficiency.
- 12. Methodology (2) ▪ Four sectors in the ODYSSEE indicators which are mainly covered by the ETS and which represent a large share of the EU ETS emissions: ▪ Primary metals (mainly iron/steel and non-metallic minerals) ▪ Non-metallic minerals (cement, glass, bricks, ceramics) ▪ Chemicals (e.g. steam crackers) ▪ Paper industry ▪ Difference between energy consumption of 4 branches in ODYSSEE and in the European Union Transaction Log (EUTL) about 2%
- 13. Effect 1 - fuel efficiency industry ▪ No fuel savings observable in industry due to the ETS. ▪ The trend in savings as determined from the baseline 1995-2004 has been interrupted by the economic and financial crises in the years 2008/9 and following years. ▪ After this period of time, the fuel savings continued with a similar path as during 1995-2004 up to 2019. Source: own calculation based on Odyssee Database
- 14. Evolution of specific emissions cement clinker ▪ Difficult data context: e.g. WBCSD GNR change in specific emissions related to biomass ▪ Gradual adaption over time leads to apparent decrease in emissions per tonne of cement ▪ Not confirmed by analysis based on EUTL Source: Impacts of the Allocation Mechanism Under the Third Phase of the European Emission Trading Scheme https://www.mdpi.com/1996-1073/11/6/1443#
- 15. Effect 2 - electricity efficiency All industrial branches ▪ Significant electricity savings observable in industry. ▪ However, there is most likely a strong impact from eco-design and labelling policies in industry which have had strong impact on cross-cutting technologies such as electric motors. ▪ One step forward could by taken in the analysis by separating cross-cutting technologies from process- specific technologies. However, no long-term data series are available for this analysis. Source: own calculation based on Odyssee Database
- 16. Effect 3 - enhanced fuel shift industrial sector ▪ Observable effects are at the limit of sensitivity. ▪ Potential energy savings from the use of more efficient fuels are already included in Effect 1. ▪ Therefore, this effect has only (potential) additional impacts in terms of decarbonisation of the fuel supply. ▪ This is expressed as the average emission coefficient for the fuels used in industry. Source: own calculation based on Odyssee Database
- 17. Effect 4 – carbon leakage/reduction in production volume ▪ The possible impact of the ETS on production volumes of products in manufacturing industries and the possible shift of production to outside Europe (carbon leakage) cannot be dealt with the methodology of the ODYSSEE indicators. Requires analysis of trade patterns ▪ Also, the effect arises from reduced activity levels, which in the industry sector may be less desirable. ▪ Past studies did not find significant carbon leakage during the first phase of the EU ETS, e.g. IEA (2008); Healy et al. (2018). ▪ The sectors examined showed no marked changes in trade flows and production patterns: • Explanations advanced: carbon leakage may have been hidden to the free allocation of allowances. • Largely free allocation to ETS industry has been valid up to 2020 (Phase 3), despite the introduction of benchmarks and will continue to 2030, though linked to more stringent features. • Low carbon price levels ▪ In future: effect could be visible but more and more countries embark on ETS schemes though ambition levels can be different.
- 18. Effect 5 - thermal power plant efficiency ▪ While efficiency improvements are observable, they are lower during the ETS phases than the baseline, implying that the ETS was not a main driving factor. ▪ The potential effect is measured through the average efficiency of thermal power plants (notably oil, natural gas, coal/lignite and biomass). ▪ May be explained by fact that efforts of supplier shift away from improving technology to be phased out as well as by limitations in technology to improve further. Source: own calculation based on ENERDATA Global Stat
- 19. Effect 6 - enhanced penetration of efficient power plants ▪ Effect by far the largest observable. ▪ Expressed as average efficiency of the power sector which raised by 10 points, leading to substantial primary energy savings. ▪ Dedicated RES policies (feed-in tariffs, obligation schemes) played major role inprimary energy savings. ▪ Previous EU ETS impact assessments concluded on relatively large contri- bution to the shift observed towards RES. Given the relatively low ETS prices in most of the period up to 2018, it is doubtful that the effect is so large. ▪ Only starting 2018, the relatively steep decline of lignite and coal on the power sector could be related to the strongly increasing ETS prices. Source: own calculation based on ENERDATA Global Stat
- 20. Effect 7 - electricity efficiency All sectors (excl. ind.) ▪ There are some significate savings observable for other sectors than industry though limited. ▪ Industry already considered in Effect 2 ▪ Nevertheless, the same remark applies than for industry: stronger eco- design standards and labels, as well as top- runner programmes for electric appliances in households and the services sector could explain those additional savings as compared to the regulation during the base period 1995-2004. Source: own calculation based on Odyssee Database
- 21. Effect 8 – efficient hourly power plant dispatch ▪ One central impact of the ETS in the power sector is the change in plant dispatch caused by higher generation cost for CO2-intensive generation technologies due to carbon pricing. ▪ This implies that less carbon intensive fuels such as natural gas or renewables are used more intensively in the daily dispatch of power plants compared to oil and coal. ▪ RES policies have in so far an impact as they prescribe generally priority for renewable energy sources in the dispatch. ▪ The ETS has therefore rather an impact on the dispatch of less carbon-intensive fossil fuels than on the dispatch of renewables. ▪ Such effects are included in effect 6 representing the change in the power plant mix and cannot be easily separated on an annual basis from investment effects such as enhanced investments in renewables. ▪ Detailed hourly modelling of power sector dispatch required.
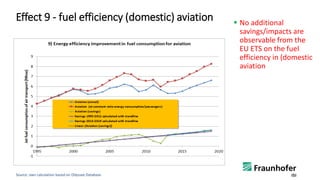
- 22. Effect 9 - fuel efficiency (domestic) aviation ▪ No additional savings/impacts are observable from the EU ETS on the fuel efficiency in (domestic aviation Source: own calculation based on Odyssee Database
- 23. Effect 10 - share of (domestic) aviation in Mobility ▪ No additional savings/impacts are observable from the EU ETS on the (domestic) aviation share in modes. ▪ There is also the impact visible of the economic/ financial crises but finally, aviation took up the same speed in the period 2013-2019 than for the baseline period (excluding the period of economic down-turn) Source: own calculation based on Odyssee Database
- 24. Summary of results for the possible impacts of the EU ETS on the different effects in the period 2005-2019/2020 ▪ Maximum energy savings of around 107 Mtoe and CO2 savings of around 218 Mt CO2 observed for 2019/2020 ▪ Mostly stemming from Effect 6, the power plant mix. ▪ At least partially or even to a large degree influenced by other factors than the EU ETS such as renewables policies or fuel prices
- 25. ▪ Enhanced GhG targets (-55% by 2030): strong link between general targets and EU ETS ▪ A bundle of enhanced features: ▪ a one-off reduction to the cap and increased linear reduction factor (from 2.2% to 4.2%); ▪ inclusion of the maritime sector into the EU ETS’ scope from 2023 onwards; ▪ a separate fuel ETS for buildings and transport (danger: ETS as an instrument for everything); ▪ strengthened benchmarks and a faster phase down of free allocation which would be tied to low-carbon investment by the receiving entity; ▪ introduction of a carbon border adjustment mechanism (CBAM) that prices imported goods based on their embedded emissions to become fully operational by 2026; ▪ updated parameters of the Market Stability Reserve (MSR) including a new buffer threshold and an extension of the current intake rate of 24% beyond 2023; ▪ new regulations around revenue use to address distributional effects and spur innovation, including the creation of the Social Climate Fund. ▪ use of offsets is not envisaged Outlook on European Green Deal / Fit for 55 packages and EU ETS (Phase 4) Quite a number of features to keep the allowance price at sufficiently high levels. More impacts of ETS to be seen by 2030
- 26. Seite 26 MANY THANKS FOR YOUR ATTENTION! Wolfgang Eichhammer Head of the Competence Center Energy Policy and Energy Markets Fraunhofer Institute for Systems and Innovation Research ISI Breslauer Straße 48 | 76139 Karlsruhe | Germany Phone +49 721 6809-158 | Fax +49 721 6809-158 mailto: wolfgang.eichhammer@isi.fraunhofer.de https://www.isi.fraunhofer.de and Utrecht University Copernicus Institute of Sustainable Development Princetonlaan 8a 3584 CS UTRECHT The Netherlands Email: w.a.eichhammer@uu.nl