


2018 DRR Financing 6.1 Ben Slay
- 1. Financing the SDGs in Middle- Income Europe and Central Asia Ben Slay Senior advisor UNDP Regional Bureau for Europe and CIS 4 October 2018
- 2. 2015—Inter-governmental conferences Sustainable Development Summit (UNGA) Sendai Disaster Risk Reduction Conference Paris Climate Change Summit Addis Ababa Finance for Development Conference Key principles: 1) Coherence 2) Sustainability 3) Risk and resilience 4) Leave no one behind 5) ODA is not enough
- 3. Potential finance for the SDGs, Sendai implementation • Key questions: – Finance demand: How much will this cost? – Finance supply: • How much money is out there? • How much of “development finance” can be treated as “potential SDG (or Sendai) finance”? • Key problems: – These questions are usually answered via global estimates . . . What about national estimates? – Demand side: Until SDGs, Sendai are “nationalized”, they can’t really be costed • Supply side: Potential funding/financing availability can be estimated
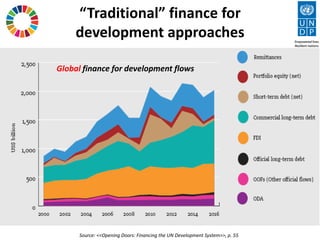
- 4. “Traditional” finance for development approaches Global finance for development flows Source: <<Opening Doors: Financing the UN Development System>>, p. 55
- 5. Problems with such approaches • Financing development is not only about net transfers of capital from developed to developing countries – It’s also about boosting development potential, competitiveness • Not all developing economies are net recipients of international capital flows (current-account deficits) – Azerbaijan, Kazakhstan, Turkmenistan, Uzbekistan are net international capital suppliers (current-account surpluses) • SDG, DRR finance is not only external – Domestic financial flows (e.g., government budget) matter—but are not captured • Financial services also matter—but are not captured – Particularly relevant for insurance ☺ • Who are the national stakeholders, partners?
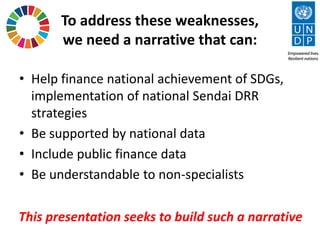
- 6. To address these weaknesses, we need a narrative that can: • Help finance national achievement of SDGs, implementation of national Sendai DRR strategies • Be supported by national data • Include public finance data • Be understandable to non-specialists This presentation seeks to build such a narrative
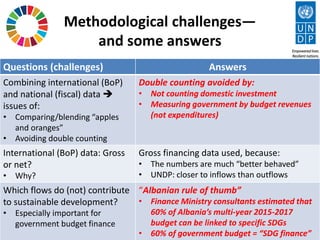
- 7. Methodological challenges— and some answers Questions (challenges) Answers Combining international (BoP) and national (fiscal) data issues of: • Comparing/blending “apples and oranges” • Avoiding double counting Double counting avoided by: • Not counting domestic investment • Measuring government by budget revenues (not expenditures) International (BoP) data: Gross or net? • Why? Gross financing data used, because: • The numbers are much “better behaved” • UNDP: closer to inflows than outflows Which flows do (not) contribute to sustainable development? • Especially important for government budget finance “Albanian rule of thumb” • Finance Ministry consultants estimated that 60% of Albania’s multi-year 2015-2017 budget can be linked to specific SDGs • 60% of government budget = “SDG finance”
- 8. Data sources • National balance of payments statistics: – International capital flow data – International financial service transactions data • (Re)insurance – Remittances • OECD-DAC: ODA data • IMF-World Economic Indicators data base: Domestic public finance data Exclusive reliance on publicly available data
- 9. Albania Shares of potential SDG finance from all sources (annual averages, 2008-2016) 17% 1% 6% 1% 12% 6% 58% FDI Stocks and bonds Bank loans Financial services Remittances ODA State budget
- 10. Armenia Shares of potential SDG finance from all sources (annual averages, 2008-2016) 11% 2% 14% 0% 37% 7% 29% FDI Stocks and bonds Bank loans Financial services Remittances ODA State budget
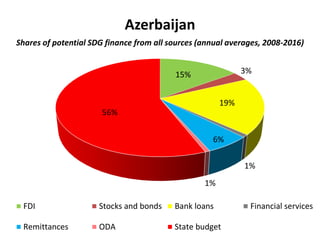
- 11. Azerbaijan Shares of potential SDG finance from all sources (annual averages, 2008-2016) 15% 3% 19% 1% 6% 1% 56% FDI Stocks and bonds Bank loans Financial services Remittances ODA State budget
- 12. Belarus Shares of potential SDG finance from all sources (annual averages, 2008-2016) 12% 1% 15% 1% 6% 1% 64% FDI Stocks and bonds Bank loans Financial services Remittances ODA State budget
- 13. Georgia Shares of potential SDG finance from all sources (annual averages, 2008-2016) 17% 3% 0% 2% 15% 9% 54% FDI Stocks and bonds Bank loans Financial services Remittances ODA State budget
- 14. Kazakhstan Shares of potential SDG finance from all sources (annual averages, 2008-2016) 32% 4% -1% 1% 0%0% 63% FDI Stocks and bonds Bank loans Financial services Remittances ODA State budget
- 15. Kosovo* Shares of potential SDG finance from all sources (annual averages, 2008-2016) (* as per UNSCR 1244 (1999)) 10% 5% 5% 1% 20% 15% 43% FDI Stocks and bonds Bank loans Financial services Remittances ODA State budget
- 16. Kyrgyzstan Shares of potential SDG finance from all sources (annual averages, 2008-2016) 12% 0% 5% 0% 40%12% 30% FDI Stocks and bonds Bank loans Financial services Remittances ODA State budget
- 17. Macedonia, fYR Shares of potential SDG finance from all sources (annual averages, 2008-2016) 11% 4% 9% 1% 12% 6% 57% FDI Stocks and bonds Bank loans Financial services Remittances ODA State budget
- 18. Moldova Shares of potential SDG finance from all sources (annual averages, 2008-2016) 4% 0% 19% 0% 35% 8% 32% FDI Stocks and bonds Bank loans Financial services Remittances ODA State budget
- 19. Montenegro Shares of potential SDG finance from all sources (annual averages, 2008-2016) 21% 3% 4% 2% 12% 3% 56% FDI Stocks and bonds Bank loans Financial services Remittances ODA State budget
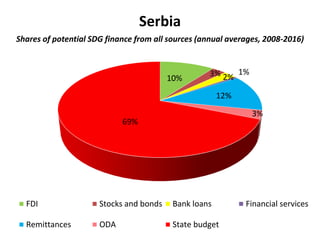
- 20. Serbia Shares of potential SDG finance from all sources (annual averages, 2008-2016) 10% 3% 2% 1% 12% 3% 69% FDI Stocks and bonds Bank loans Financial services Remittances ODA State budget
- 21. Turkey Shares of potential SDG finance from all sources (annual averages, 2008-2016) 4% 4% 6% 1% 1% 1% 84% FDI Stocks and bonds Bank loans Financial services Remittances ODA State budget
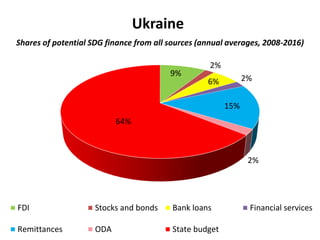
- 22. Ukraine Shares of potential SDG finance from all sources (annual averages, 2008-2016) 9% 2% 6% 2% 15% 2% 64% FDI Stocks and bonds Bank loans Financial services Remittances ODA State budget
- 23. By source of finance: State budget (* as per UNSCR 1244 (1999)) Annual averages (2008- 2016), shares of total finance (from all sources) 84% 69% 64% 64% 63% 58% 57% 56% 56% 54% 43% 32% 30% 29%
- 24. By source of SDG finance: Remittances Annual averages (2008- 2016), shares of total finance (from all sources) (* as per UNSCR 1244 (1999)) 40% 37% 35% 20% 15% 15% 12% 12% 12% 6% 6% 3% 1% 0%
- 25. By source of finance: ODA Annual averages (2008- 2016), shares of total finance (from all sources) (* as per UNSCR 1244 (1999)) 15% 12% 9% 8% 7% 6% 6% 3% 3% 2% 1% 1% 1% 0%
- 26. Commercial financial flows Annual averages (2008-2016), shares of total SDG finance (from all sources) (* as per UNSCR 1244 (1999)) 0% 10% 20% 30% 40% 15% 32% 12% 21% 11% 11% 17% 4% 17% 10% 9% 12% 10% 4% 3% 4% 1% 3% 2% 4% 1% 3% 5% 2% 0% 3% 4% 19% -1% 15% 4% 14% 9% 6% 19% 5% 6% 5% 2% 6% FDI Stock and bonds Bank loans Financial services 38% 37% 30% 29% 27% 26% 25% 24% 23% 21% 18% 18% 16% 15%
- 27. Critical next step: Unpacking domestic public finance 15% 13% 13% 13% 11% 9% 9% 7% 5% 4% • Albanian example: – 2015-2017 budget reviewed – 61% of budget lines could be linked to individual SDGs Source: Albania <<MAPS>> report, p. 87 • Could/should something similar be done in your country? • Should a similar exercise be attempted for commercial flows?
- 28. Some take-aways • State budget finance is critical – More sophisticated treatment of fiscal data needed • ODA still matters in some places – Especially for global leaders in remittance inflows (Kyrgyzstan, Armenia, Moldova, Kosovo, Georgia) • This underscores the importance of “blending” remittances with ODA, budget finance • On commercial flows: – FDI, bank loans are larger than flows associated with stocks and bonds, financial services – In economies with largest commercial flows (Azerbaijan, Kazakhstan), most of this goes to the extractive sector
- 29. Thank you very much! (ben.slay@undp.org)