Location via proxy:   [ UP ]  
[Report a bug]   [Manage cookies]                
SlideShare a Scribd company logo
E. I. DUPONT DE NEMOURS AND COMPANY AND CONSOLIDATED SUBSIDIARIES


                                                    ANNUAL PERFORMANCE RATIOS


                                                                                                       Year         Year         Year        Year        Year
                                                                                                       2007         2006         2005        2004        2003

     Total stockholder return                                                                            (6.4)%      18.1%       (10.4)%       9.9%       11.5%
        Dividend yield                                                                                     3.4%       3.0%          3.4%       2.9%        3.1%
        Share price (decrease) increase                                                                  (9.5)%      14.6%       (13.4)%       6.9%        8.2%

     P/E on income (1) (2)                                                                                    14           14           21          28          46
     P/E on income before significant items (1) (2)                                                           13           17           18          21          28

     Dividend payout, as percentage of:
         Earnings per share (1)                                                                          47.2%       43.8%        70.5%       79.1%      141.4%
         Earnings per share before significant items (1)                                                 46.3%       51.4%        62.4%       58.8%       84.3%

     Return on average stockholders' equity (1) (3)                                                      25.1%       30.2%        17.3%       15.0%        8.2%
     Return on average stockholders' equity before significant items (1) (3)                             25.6%       25.7%        19.6%       20.2%       14.1%

     Return on average invested capital (1) (3)                                                          15.9%       17.6%        11.1%        8.7%        5.2%
     Return on average invested capital before significant items (1) (3)                                 16.2%       15.3%        12.4%       11.5%        8.0%
                                                                                  (4)
     Cash provided by operating activities as a percentage of total debt                                 58.6%       49.6%        31.1%       49.8%       24.7%
     Debt to total capital (4)                                                                           38.8%       43.3%        46.4%       34.2%       50.3%
     Current ratio (4)                                                                                      1.5         1.6          1.7         1.9         1.2
     Asset turnover ratio                                                                                 86%         86%          80%         77%         73%


     (1)   Ratio is based on income before cumulative effect of changes in accounting principles.
     (2)   Based on year-end share price
     (3)   Ratio is adjusted to reflect the exclusion of accumulated other comprehensive income.
     (4)   Ratio includes related assets and/or liabilities classified as held for sale within the Consolidated Balance Sheet.


Annual Performance Ratios                                                                                                                                            1
RECONCILIATION OF NON-GAAP MEASURES
                                                                                                      (dollars in millions)


RECONCILIATION OF ROE - RETURN ON AVERAGE STOCKHOLDERS' EQUITY (1)                                                                           2007     2006         2005     2004      2003

   Net income - 12 months ending December 31                                                                                                $ 2,988 $ 3,148 $ 2,056 $ 1,780 $           973
   Cumulative effect of a change in accounting principle, net of income taxes                                                                   -        -            -        -         29
   Remove: Significant items - charge/(benefit) (2)                                                                                             55      (463)        276      613       667
   Income before significant items and cumulative effect of changes in accounting principle                                                 $ 3,043 $ 2,685 $ 2,332 $ 2,393 $ 1,669


   Average Stockholders' equity, excluding accumulated other comprehensive income                                                           $11,892 $10,437 $11,872 $11,844 $11,821


   ROE                                                                                                                                         26%      26%          20%      20%       14%


RECONCILIATION OF ROIC - RETURN ON AVERAGE INVESTED CAPITAL(3)

   Net income - 12 months ending December 31                                                                                                $ 2,988   $3,148       $2,056 $ 1,780 $     973
   Significant items - charge/(benefit) (2)                                                                                                     55      (443)        276      631       650
   Adjustments:
         Cumulative effect of a change in accounting principle, net of income taxes                                                             -       -            -         -         29
         Minority interests in earnings (losses) of consolidated subsidiaries                                                                    7      (15)          37       (9)       71
         Interest expense - after-tax                                                                                                          219      262          280      190       116
   Income before significant items and adjustments for ROIC calculation                                                                      $3,269   $2,952       $2,649   $2,592   $1,839


   Sum average of:

          Short-term / long-term borrowings and capital lease obligations                                                                    $7,896   $8,397       $8,755   $9,843   $9,816
          Minority interests                                                                                                                    441      475          756      871    1,325
          Stockholders' equity, excluding accumulated other comprehensive income                                                             11,892   10,437       11,872   11,844   11,821
   Average invested capital, excluding accumulated other comprehensive income                                                               $20,229 $19,309 $21,383 $22,558 $22,962


   ROIC                                                                                                                                        16%      15%          12%      11%        8%


RECONCILIATION OF INTEREST COVERAGE RATIO


   Total Interest on Borrowings (4)                                                                                                            396      424          351      270       286

   Adjusted EBIT (excluding impact of significant items)                                                                                      4,338    3,875        3,912    3,107    2,252

   Interest Coverage Ratio                                                                                                                     11.0          9.1     11.1     11.5       7.9


       (1) ROE is determined by dividing previous 12 months of Net income before significant items by the average of stockholders' equity
            (excluding accumulated other comprehensive income) position at end of previous 5 calendar quarters.

       (2) Details of Significant items are provided in company's Quarterly Earnings News Releases.
       (3) ROIC is adjusted to reflect the exclusion of accumulated other comprehensive income (AOCI). ROIC is determined by dividing
            previous 12 months of Net Income before significant items and adjustments for ROIC calculation by the average of invested
            capital position (excluding AOCI) at end of previous 5 calendar quarters.
       (4) includes interest incurred less interest income


Annual Performance Ratios                                                                                                                                                                      2

More Related Content

du pont Earnings Release

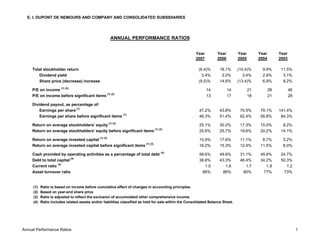
  • 1. E. I. DUPONT DE NEMOURS AND COMPANY AND CONSOLIDATED SUBSIDIARIES ANNUAL PERFORMANCE RATIOS Year Year Year Year Year 2007 2006 2005 2004 2003 Total stockholder return (6.4)% 18.1% (10.4)% 9.9% 11.5% Dividend yield 3.4% 3.0% 3.4% 2.9% 3.1% Share price (decrease) increase (9.5)% 14.6% (13.4)% 6.9% 8.2% P/E on income (1) (2) 14 14 21 28 46 P/E on income before significant items (1) (2) 13 17 18 21 28 Dividend payout, as percentage of: Earnings per share (1) 47.2% 43.8% 70.5% 79.1% 141.4% Earnings per share before significant items (1) 46.3% 51.4% 62.4% 58.8% 84.3% Return on average stockholders' equity (1) (3) 25.1% 30.2% 17.3% 15.0% 8.2% Return on average stockholders' equity before significant items (1) (3) 25.6% 25.7% 19.6% 20.2% 14.1% Return on average invested capital (1) (3) 15.9% 17.6% 11.1% 8.7% 5.2% Return on average invested capital before significant items (1) (3) 16.2% 15.3% 12.4% 11.5% 8.0% (4) Cash provided by operating activities as a percentage of total debt 58.6% 49.6% 31.1% 49.8% 24.7% Debt to total capital (4) 38.8% 43.3% 46.4% 34.2% 50.3% Current ratio (4) 1.5 1.6 1.7 1.9 1.2 Asset turnover ratio 86% 86% 80% 77% 73% (1) Ratio is based on income before cumulative effect of changes in accounting principles. (2) Based on year-end share price (3) Ratio is adjusted to reflect the exclusion of accumulated other comprehensive income. (4) Ratio includes related assets and/or liabilities classified as held for sale within the Consolidated Balance Sheet. Annual Performance Ratios 1
  • 2. RECONCILIATION OF NON-GAAP MEASURES (dollars in millions) RECONCILIATION OF ROE - RETURN ON AVERAGE STOCKHOLDERS' EQUITY (1) 2007 2006 2005 2004 2003 Net income - 12 months ending December 31 $ 2,988 $ 3,148 $ 2,056 $ 1,780 $ 973 Cumulative effect of a change in accounting principle, net of income taxes - - - - 29 Remove: Significant items - charge/(benefit) (2) 55 (463) 276 613 667 Income before significant items and cumulative effect of changes in accounting principle $ 3,043 $ 2,685 $ 2,332 $ 2,393 $ 1,669 Average Stockholders' equity, excluding accumulated other comprehensive income $11,892 $10,437 $11,872 $11,844 $11,821 ROE 26% 26% 20% 20% 14% RECONCILIATION OF ROIC - RETURN ON AVERAGE INVESTED CAPITAL(3) Net income - 12 months ending December 31 $ 2,988 $3,148 $2,056 $ 1,780 $ 973 Significant items - charge/(benefit) (2) 55 (443) 276 631 650 Adjustments: Cumulative effect of a change in accounting principle, net of income taxes - - - - 29 Minority interests in earnings (losses) of consolidated subsidiaries 7 (15) 37 (9) 71 Interest expense - after-tax 219 262 280 190 116 Income before significant items and adjustments for ROIC calculation $3,269 $2,952 $2,649 $2,592 $1,839 Sum average of: Short-term / long-term borrowings and capital lease obligations $7,896 $8,397 $8,755 $9,843 $9,816 Minority interests 441 475 756 871 1,325 Stockholders' equity, excluding accumulated other comprehensive income 11,892 10,437 11,872 11,844 11,821 Average invested capital, excluding accumulated other comprehensive income $20,229 $19,309 $21,383 $22,558 $22,962 ROIC 16% 15% 12% 11% 8% RECONCILIATION OF INTEREST COVERAGE RATIO Total Interest on Borrowings (4) 396 424 351 270 286 Adjusted EBIT (excluding impact of significant items) 4,338 3,875 3,912 3,107 2,252 Interest Coverage Ratio 11.0 9.1 11.1 11.5 7.9 (1) ROE is determined by dividing previous 12 months of Net income before significant items by the average of stockholders' equity (excluding accumulated other comprehensive income) position at end of previous 5 calendar quarters. (2) Details of Significant items are provided in company's Quarterly Earnings News Releases. (3) ROIC is adjusted to reflect the exclusion of accumulated other comprehensive income (AOCI). ROIC is determined by dividing previous 12 months of Net Income before significant items and adjustments for ROIC calculation by the average of invested capital position (excluding AOCI) at end of previous 5 calendar quarters. (4) includes interest incurred less interest income Annual Performance Ratios 2