EDP Energias do Brasil Presentation
- 1. EDP Energias do Brasil Novembro de 2009
- 2. Disclaimer This presentation may include forward-looking statements of future events or results according to regulations of the Brazilian and international securities and exchange commissions. These statements are based on certain assumptions and analysis by the company that reflect its experience, the economic environment and future market conditions and expected events, many of which are beyond the control of the company. Important factors that may lead to significant differences between the actual results and the statements of expectations about future events or results include the company’s business strategy, Brazilian and international economic conditions, technology, financial strategy, public service industry developments, hydrological conditions, financial market conditions, uncertainty of the results of future operations, plans, objectives, expectations and intentions, among others. Considering these factors, the actual results of the company may be significantly different from those shown or implicit in the statement of expectations about future events or results. The information and opinions contained in this presentation should not be understood as a recommendation to potential investors and no investment decision is to be based on the veracity, current events or completeness of this information or these opinions. No advisors to the company or parties related to them or their representatives shall have any responsibility for whatever losses that may result from the use or contents of this presentation. This material includes forward-looking statements subject to risks and uncertainties, which are based on current expectations and projections about future events and trends that may affect the company’s business. These statements include projections of economic growth and energy demand and supply, as well as information about the competitive position, the regulatory environment, potential opportunities for growth and other matters. Several factors may adversely affect the estimates and assumptions on which these statements are based. . 2
- 3. EDP: Successful Story in the Brazilian Power Sector Generation Distribution Commercialization Consolidated Net Revenue 2008¹ 791 3,955 773 4,904 (R$ million) Adjusted EBITDA 2008¹ 570 801 51 1,363 (R$ million) Participation in 40% 56% 4% 100% EBITDA 2008¹ 5th largest private 4th largest private 3rd largest private generator by installed distributor in the trading company in capacity Brazilian power sector the Brazilian power in terms of energy sector in terms of Important partnership sold electricity traded with EDP Renováveis – 4th largest operator of wind generation projects in the world 3 Source: Emerging Energy Consulting and CCEE reports. Note: (1) Segment values in Reais and percentages do not consider intra-group eliminations.
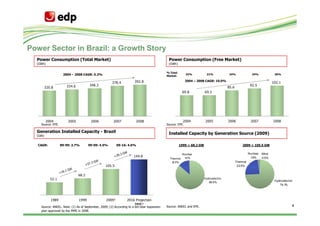
- 4. Power Sector in Brazil: a Growth Story Power Consumption (Total Market) Power Consumption (Free Market) (GWh) (GWh) % Total 2004 – 2008 CAGR: 5.2% 22% 21% 24% 24% 26% Market: 392.8 2004 – 2008 CAGR: 10.0% 378.4 102.1 334.6 348.3 92.5 320.8 85.6 69.8 69.5 2004 2005 2006 2007 2008 2004 2005 2006 2007 2008 Source: EPE. Source: EPE. Generation Installed Capacity - Brazil Installed Capacity by Generation Source (2009) (GW) CAGR: 89-99: 2.7% 99-09: 4.5% 09-16: 4.6% 1999 = 68.2 GW 2009 = 105.5 GW Nuclear Nuclear Wind 144.8 1.0% 1.9% 0.5% Thermal 12.5% Thermal 105.5 23.5% 68.2 52.1 Hydro electric 86.5% Hydro electric 74.1 % 1989 1999 2009¹ 2016 Projection MME² 4 Source: ANEEL. Note: (1) As of September, 2009; (2) According to a ten-year expansion Source: ANEEL and EPE. plan approved by the MME in 2008.
- 5. EDP History in Brazil In 1997, EDP initiated investments that resulted today in the EDP - Energias do Brasil platform. The company executed on its strategy for international expansion and participated actively in the privatization process for distribution companies and public tenders for generation projects in Brazil. Generation and Trading SHPs São João Investment in and Santa Fé Creation of EDPR Lajeado 4th turbine of Acquisition of Peixe Angical initiated BR and Mascarenhas (partnership with Furnas) operations acquisition of initiated operation CENAEEL A-5 auction TPP Pecém 1997 - 2002 2003 - 2004 2005 - 2009 Distribution Acquisition of Acquisition of Received Bandeirante control of Asset swap Investment Escelsa and (Enersul for Grade from Acquisition of Iven Enersul Lajeado) (Escelsa and Enersul) Moody´s Creation Corporate IPO Group of EDP reorganization and Brasil Unbundling of Spin-off of new governance model of the Group distribution and Bandeirante generation activities 5
- 6. Corporate Governance, Social and Environmental Responsibility Independent Controlling Audit Committee Independent President Shareholder Sustainability and Independent Controlling Corporate Governance Independent President Shareholder Board of Directors Committee 8 members (4 independent) Compensation Chairman of the Controlling Independent Committee Board of Directors Shareholder Code of Ethics EDP Institute Social, cultural and environmental activities Transparency Policy of minimum dividend payment of 50% of net income 6
- 7. Distribution Companies in Attractive Areas Strong concentration in the residential and industrial segments, covering 98 cities, being 28 in São Paulo and 70 in Espírito Santo Attractive growth profile 2.6 million clients (total concession area with a population of approx. 8 million) Total concession area of 50.9 thousand km2 Energy Distributed by Segment • Located in São Paulo, main economic center of Brazil with Residential Free 23% high industrial concentration Customers 35% 1st economy of the country with ~33% of national GDP Industrial Others 22% 1.4 million clients in a total area of 9.6 thousand km2 7% Commercial 13% Concession period: 30 years, until 2028 Free Residential • Located in Espírito Santo, an exporter-centric state with 22% Customers strong economic activity: 32% Industrial 11th largest economy in the country with 2.3% of 12% national GDP Others Commercial 20% 14% 1.1 million clients in a total area of 41.2 thousand km2 Concession period: 30 years, until 2025 7
- 8. Distribution Companies with Diversified Client Base Energy Sold by Segment (Captive Clients)1 (MWh) Others² 13,298 15% 12,610 13,226 12,137 1,939 2,024 2,029 Others Residential 1,834 35% 2,523 2,642 2,736 Commercial 2,342 4,156 3,908 Industrial Commercial 4,052 4,018 21% 3,908 4,130 4,402 4,626 Residential 2006 2007 2008 LTM³ Industrial 29% Energy Losses Tariffs / Adjustments BANDEIRANTE ANEEL TARGET ESCELSA Bandeirante 20074 2008 2009 14.2% 14.7% 12.3% Tariff Adjustment - % -13.46 14.48 5.46 10.4% 5.6% 5.9% 10.9% 1 .0% 1 Next Tariff Revision Oct 11 5.1% 5.4% 5.7% 5.9% Escelsa 20074 2008 2009 8.7% 8.8% 7.2% Tariff Adjustment - % -2.16 12.17 15.12 5.2% 5.1% 5.0% Next Tariff Revision Aug 10 3Q08 3Q09 Bandeirante Escelsa 3Q08 3Q09 Notes: (1) Data refers only to Bandeirante and Escelsa; (2) Others include: rural, public power, public illumination and public service; (3) Last 12 months, as of September 2009; (4) 8 Tariff revision.
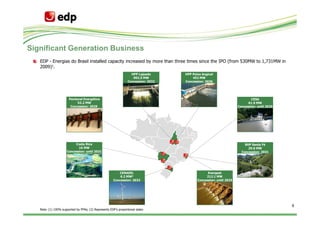
- 9. Significant Generation Business EDP - Energias do Brasil installed capacity increased by more than three times since the IPO (from 530MW to 1,731MW in 2009)1. HPP Lajeado HPP Peixe Angical 902.5 MW 452 MW Concession: 2032 Concession: 2036 Pantanal Energética CESA 52.2 MW 61.9 MW Concession: 2029 Concession: until 2025 Costa Rica SHP Santa Fé 16 MW 29.0 MW Concession: until 2031 Concession: 2031 CENAEEL Energest 6.2 MW2 212.1 MW Concession: 2032 Concession: until 2025 9 Note: (1) 100% supported by PPAs; (2) Represents EDP’s proportional stake.
- 10. Attractive Generation Projects Projects Under Construction and Near Term Development Development Pipeline Under Construction: Thermal coal-fired – Pecém 360 MW(1) Small and Medium Hydro Plants (SHPs) 500 MW Auction A-5 from 2007 Start Year 2012 Wind farms 240 MW(1) Ownership: 55% EDPR / 45% EDP Energias do Brasil Installed Capacity 720 MW (615 average MW) Ownership 50% EDP / 50% MPX Thermal Gas-Fired Combined-Cycle Plant - RJ 500 MW Financing 75% Debt / 25% Equity BNDES R$1.4 billion approved R$700 million disbursed Total 1,240 MW Tenor: 17 years IDB US$327 million approved US$260 million disbursed Tenor: 13 and 17 years Near-term Development: Wind farm 31.5MW(1) Wind farm in Rio Grande do Sul Ownership 55% EDPR / 45% EDP Energias do Brasil 10 Note: (1) Represents EDP’s proportional stake.
- 11. Main Accomplishments and Strategy
- 12. Our Accomplishments Since the 2005 IPO 1 Installed capacity 1 1,731 (MW) +227% Expand generation business 530 − Installed capacity increased by 227% 2004 Current 2 2 Distribution productivity Results (2004 vs Current) Results (2004 vs Current) (clients/employee)¹ Improve operating efficiency 1,294 Our Commitments 927 − Productivity increased by 40% 2004 Current 3 3 12-month energy sold (GWh) +68% Develop trading business 8,164 − Traded energy increased by 68% 4,849 2004 Current 4 4 Ranking among private capital companies Consolidate position in the Brazilian power sector Trading Business 3rd − Distinguished position in several rankings Distributed Energy 4th Installed Capacity 5th 12 Note: (1) Data refers to Bandeirante and Escelsa.
- 13. Expansion of Generation Business Growth in Installed Capacity (MW) 6 29 25 360 2009 2009 2011 2009 653 and 50 25 2010 2,116 2008 1,731 452 Expectation of New 1,043 Operation 516 2 2005 HPP Peixe 4th turbine SHP São 2007 Additional Cenaeel SHP Santa 2009 Power TPP Pecém 2011 Angical Mascarenhas João Capac. Fé Upgrades Lajeado Generation Investments Energy Sold from Generation Plants (GWh) Pre-IPO (1997 - 2004) 2006 – LTM CAGR: +19% Cumulative Investment: R$1.3 billion 7,660 6,411 5,568 Post-IPO (2005 - Current) 4,758 Cumulative Investment: R$2.0 billion Asset Swap: Exchange stake in Enersul to increase direct and indirect stake in UHE Lajeado − Investment: R$753 million 2006 2007 2008 LTM¹ 13 Note: (1) Last 12 months, as of September 2009. (2) UTE Pecém will be finished in 2011, and will start to operate in the beginning of 2012.
- 14. Improvement in Operational Efficiency Productivity – Distribution Productivity – Distribution (Clients - thousands / Employee) (GWh Distributed / Employee) 1.34 12.24 1.06 1.11 10.14 8.20 0.80 5.83 Bandeirante Escelsa Bandeirante Escelsa 2004 Current 2004 Current Manageable Costs Evolution1 (Opex) Project “Vencer” (R$ million, Bandeirante + Escelsa) Inflation in the period (06 – Sep/09): 17.8%% Initiated in the first quarter of 2009 45.0% 46.1% Main accomplishments: 43.2% 42.7% 41.7% 700 730 Reduction of organizational layers from 5 to 3 681 47 88 50 165 158 500 525 40% reduction in number of managerial positions 165 38 54 123 125 Reduction in the average age of managerial positions 489 484 466 Reduction in personnel expenses 339 346 2006 2007 2008 9M08 9M09 Opex D&A Provision % Gross Margin 14 Note: (1) Manageable costs include: personnel, material, third-party services, provisions, depreciation and amortization costs for distribution companies Bandeirante and Escelsa.
- 15. Development of Trading Business Energy Traded (GWh) 2005 – LTM CAGR: +7% 8,164 7,188 7,282 6,379 6,702 60% 3,812 7,461 91% 5,509 6,374 6,527 2008 Energy Consumption 40% 2,567 1,193 814 755 703 9% Free Market 2005 2006 2007 2008 LTM¹ 26% Intra-Grup Third Parties Net Operating Revenue - Trading Business (R$ million) 2005 – LTM CAGR: +18% 773 796 618 Captive Market 495 431 74% 2005 2006 2007 2008 LTM¹ 15 Note: (1) Last 12 months, as of September 2009.
- 16. Consistent Track Record of Dividend Payments Since the IPO, in 2005, EDP distributed to its shareholders R$765 million and: At the same time, EDP - Energias do Brasil invested approximately R$4.2 billion in CAPEX Company leverage ratio remains at a comfortable level (1.9x Net Debt / LTM EBITDA) Dividends/Interest on Equity since IPO Payout since IPO (R$ / Share) (% Net Income) 67.5% 2005 – 2008 CAGR: +22% 1.66 50.0% EDP 46.5% 1.26 40.0% Policy 1.03 0.92 2005 2006 2007 2008 2005 2006 2007 2008 Dividend Policy: Minimum of 50% of Adjusted Net Income 16 Source: Company, BOVESPA and Bloomberg.
- 17. Solid Growth Strategy Decision Making Rules: 1. Control of the asset acquired or developed 2. Rate of return above the cost of capital 3. To maintain an adequate risk profile and debt level Generation • Continue to develop growth opportunities in the generation business, focused on: Business Expansion ― New projects with adequate rate of return Besides Pecém (360 MW) under construction, there are 1,240 MW in generation projects currently being studied ― Partnerships with other companies, with EDP retaining control Focus on partners with complementary experience, with the objective of minimizing risk and maximizing probability of success ― Acquire established generation assets • Capture growth in the free market Continue to • Optimize risk management in the integrated generation and distribution business Develop the Trading Business • Provide value-added energy solutions – Strategy to attract and retain clients 17
- 18. Solid Growth Strategy Maintain • Organic Growth Investments in Distribution – Bandeirante: 11.2% growth in GWh over the 2004-2008 period – Escelsa: 20.5% growth in GWh over the 2004-2008 period • Maximize operational efficiency • Pro-active management of the regulatory process Consolidate Position in the Brazilian Power • EDP is prepared to capture consolidation opportunities to leverage the company's Market strategy in its different segments • Consistent criteria for minimum return required and management of integration risk 18
- 20. Financial Highlights – EDP Consolidated Net Revenue EBITDA and EBITDA Margin (R$ million) (R$ million, %) 30.3% 30.7% 26.9% 27.8% 4,904 24.8% 4,528 3,985 1,363 3,492 3,416 1,074 1,123 1,057 1,049 2006 2007 2008 9M08 9M09 2006 2007 2008 9M08 9M09 EBITDA Breakdown – 9M09 Net Income (%) (R$ million) Trading 2% 450 450 394 389 288 Distribution Generation 50% 48% 1 1 2 2006 2007 2008 9M08 9M09 20 Note: (1) Includes R$129 mm impact from goodwill amortization; (2) Includes R$120 mm from the sale of ESC 90.
- 21. Comfortable Debt Profile Adequate debt management of EDP - Energias do Brasil prompted a rating upgrade by Moody’s in 2009; EDP holding is rated Ba1 – stable on a global scale, whereas Bandeirante and Escelsa are rated Baa3 - stable Net Debt1 and Net Debt / EBITDA² Total Debt Breakdown (Sep - 2009) (R$ million) (%) 2.4x 1.9x 1.9x 1.9x Fixed Rate US$ 4% 5% 2,562 2,546 2,518 2,093 TJLP CDI 37% 54% Dec-06 Dec-07 Dec-08 Sep-09 Debt Amortization Schedule³ Approved Credit Lines (R$ million) (R$ million) Pecém Tenor Availability Instrument Approved – up to Through (years 610 BNDES 900 2013 10 622 BNDES – IDB 2,000 2011 17 (Porto Pecém) 175 260 763 757 BEI 270 2010 10 457 255 479 353 107 BNDES 76 2009 14 (SHP Santa Fé) Adjusted 2009 2010 2011 2012 After Cash 2012 Total 3,246 Note: (1) Net debt = gross debt – cash and cash equivalents; (2) LTM EBITDA; (3) Consider principal, interest and hedge operations. 21


