EG's London Residential Summit
- 1. Katy Warrick Lawrence Bowles Is the London market really that bad?
- 3. London house price growth by borough -10% -5% 0% 5% 10% 15% 20% -10% -5% 0% 5% 10% 15% 20% Annualgrowth 2016 2017 Source: Savills repeat sales index
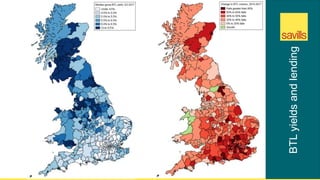
- 4. Mortgage constraints in London First Time Buyers £65,800 Household Income 4.09 Loan to Income £96,000 Deposit Home Movers £89,000 Household Income 4.09 Loan to Income Buy to Let Investors -44% fall in BTL purchases since 2014 4.56% Average gross yield (UK 5.56%) -58% fall in purchases since 2007 Source: UK Finance Q4 2017
- 5. Mainstream London Forecasts 2016 2017 2018 2019 2020 2021 2022 5 years to 2022 Capital Values +3.6% -0.5% -2.0% 0.0% +5.0% +2.0% +2.0% +7% Rental Values +5.0% -3.0% +3.0% +3.0% +3.5% +3.5% +3.0% +17% N.B. These forecasts apply to average prices in the second hand market. New Build values may not move at the same rate. Source: Savills Research, Nationwide, Rightmove
- 6. +7.1% +56.8% Source: Nationwide (to Dec 2017), Savills London Mainstream House Price Growth Last 5 years Next 5 years
- 7. HELP TO BUY Challenges Potentially more targeted at those on lower incomes/FTBs? Drivers Strong pipeline of eligible mainstream homes More developers adopting HTB MORTGAGED DOMESTIC INVESTOR Challenges SDLT Reduced tax relief Mortgage regulation Drivers Strong rental demand OVERSEAS INVESTOR Challenges SDLT and other taxes Currency window closing Chinese capital restrictions Drivers Long term fundamentals remain LARGE SCALE PRS Challenges Viability Affordable housing requirements Drivers Strong pipeline of BTR permissions Allows developers to de-risk MORTGAGED OWNER OCCUPIER Challenges Deposit affordability Mortgage regulation Rate rises looming Drivers Bank of Mum & Dad Rising appeal of new over second hand Stable demand (at 2017 levels) Continued government support and take up Biggest fall as most constraints Stable demand – fundamentals remain Continued growth of sector
- 9. ↓=6↓ East Midlands 14.8% 32.4% ↓=6↓ West Midlands 14.8% 28.4% ↓8↓ South West 14.2% 31.9% Next 5 years Last 5 years ↑1↑ North West 18.1% 23.8% ↑=2↑ North East 17.6% 10.2% ↑=2↑ Y & H 17.6% 21.7% ↑4↑ Scotland 17.0% 15.2% ↑5↑ Wales 15.9% 19.3% ↓=9↓ East 11.5% 48.3% ↓=9↓ South East 11.5% 42.0% ↓11↓ London 7.1% 56.8% Source: ONS (to Sept 2017) Savills
- 11. The BTR pipeline has grown fivefold since 2013 Source: Savills, Glenigan, Molior, BPF 0 20,000 40,000 60,000 80,000 100,000 120,000 Jan-13 Apr-13 Jul-13 Oct-13 Jan-14 Apr-14 Jul-14 Oct-14 Jan-15 Apr-15 Jul-15 Oct-15 Jan-16 Apr-16 Jul-16 Oct-16 Jan-17 Apr-17 Jul-17 Oct-17 NumberofBTRhomesinthepipeline Completed Under Construction Detailed Permission Detailed Application Long term
- 12. Sustainability Affordability Mobility Flexibility Sensitivity Longevity Luciano Pia, 25 Verde, Turin
- 14. Sustainability Affordability Mobility Flexibility Sensitivity Longevity Median FTB deposit: £96,400 Average Londoner must work until 27th August to cover rent Affordable housing delivery is 21% of need Source: UK Finance, BBC, GLA
- 15. Sustainability Affordability Mobility Flexibility Sensitivity Longevity 90% reduction in the number of vehicles?
- 20. Thank you © Savills 2018
Editor's Notes
- Guardian (Halifax) Mail (Hometrack) CityAM (YouGov)
- To Dec 2017, using Land Registry, 6 month smoothed Nationwide started recording ANNUAL price falls in Q3. Annual as at Q4 is 0.5% Savills repeat sales index shows still in slight positive territory at 1.7%.
- Rental market has sufferAssumptions Base rate, mortgage rate, GDP recovery ed in 2017 fro new supply following SDLT changes in 2016 – renewals have come in all at once, plus more new build stock. Mid-2017 we started to see investors rationalise their portfolios. Consequences are weak capital price growth – the development industry will be more reliant on HTB and PRS/BTR
- Hitting up against mortgage regulation… What does this mean in terms of price growth across the wider London market?
- EPC E or higher to let out a property – plan is to raise over next few years Luciano Pia, 25 Verde, Turin Resilience and sustainability Green development has a social value but also follows what homebuyers are looking for By 2025, demand for water in London will be 10% greater than supply – integrating water catching into design becomes a USP Heating/cooling - > lower running costs NHBC survey -> energy efficiency a key concern for buyers of newbuild
- According to the GLA Intelligence Unit, London will have 100,000 more octogenarians by 2029


