Location via proxy:   [ UP ]  
[Report a bug]   [Manage cookies]                
SlideShare a Scribd company logo
Doug Foshee
President and Chief Executive Officer
Banc of America
Annual Investor Conference
September 20, 2005
                              the place to work
                         the neighbor to have
                          the company to own
Cautionary Statement Regarding
Forward-looking Statements
This presentation includes forward-looking statements and projections, made in reliance on
the safe harbor provisions of the Private Securities Litigation Reform Act of 1995. The
company has made every reasonable effort to ensure that the information and assumptions on
which these statements and projections are based are current, reasonable, and complete.
However, a variety of factors could cause actual results to differ materially from the
projections, anticipated results or other expectations expressed in this presentation,
including, without limitation, our ability to implement and achieve our objectives in the long-
range plan, including achieving our debt-reduction targets; our ability to obtain necessary
governmental approvals for proposed pipeline projects and our ability to successfully
construct and operate such projects; our ability to meet production volume targets in our
Production segment; uncertainties associated with exploration and production activities; our
ability to successfully execute, manage, and integrate acquisitions; our ability to close our
announced asset sales on a timely basis; changes in commodity prices for oil, natural gas,
and power; general economic and weather conditions in geographic regions or markets
served by the company and its affiliates, or where operations of the company and its affiliates
are located; the uncertainties associated with governmental regulation; political and currency
risks associated with international operations of the company and its affiliates; competition;
and other factors described in the company’s (and its affiliates’) Securities and Exchange
Commission filings. While the company makes these statements and projections in good faith,
neither the company nor its management can guarantee that anticipated future results will be
achieved. Reference must be made to those filings for additional important factors that may
affect actual results. The company assumes no obligation to publicly update or revise any
forward-looking statements made herein or any other forward-looking statements made by the
company, whether as a result of new information, future events, or otherwise.


                                                                                                  2
Our Purpose


      El Paso Corporation provides
      natural gas and related energy
     products in a safe, efficient, and
           dependable manner


                                          3
El Paso Overview

    Premier natural gas pipeline franchise
►

    One of largest independent producers
►

    – Turnaround almost complete
    Significant leverage to favorable commodity
►
    fundamentals
    Excellent progress on asset sales/debt
►
    reduction


                                                  4
Significant Progress in Turnaround
                                   December 2003                            Current
    Liquidity                 Stressed                            Strong
►                         ►                                   ►


    Net debt                  $20.5 billion                       $15.9 billion*
►                         ►                                   ►


    Asset sales               Long-Range Plan (LRP) goal:         $4.3 billion sold under LRP
►                         ►                                   ►
                              $3.3 billion–$3.9 billion
                              Incremental goal:                   $1.4 billion announced or
                          ►                                   ►
                              $1.2 billion–$1.6 billion           closed

                              Pipes, E&P, marketing &             Pipes, E&P, marketing (out of
                          ►                                   ►
    Range of businesses
►
                              trading, petroleum, chemical,       or exiting all other)
                              domestic & international
                              power, midstream, others

                              Large corporate center              Small corporate center—push
                          ►                                   ►
    Corporate structure
►
                                                                  functions to businesses
                              5 divisions
                          ►
                                                                  2 divisions
                                                              ►

*As of June 30, 2005

                                                                                                5
U.S. Natural Gas Market
Macro Overview
                                              Consumption & Supply in Tcf

                                                                           Demand
                                                                           Growth
                                                  Domestic
► Gas consumption in the                                                  2004–2014
                                 35
                                                   supply
  power sector will grow
                                 30
  substantially
                                                                           +5.0 Tcf
                                 25
   – 200 GWs of gas-fired                            Power Generation
     generating capacity built
                                 20
     since 2000
                                                                           +1.0 Tcf
                                                             Industrial
► Domestic   supply grows        15
  slowly                                                                   +0.4 Tcf
                                                          Commercial
                                 10
► More than $20 billion in                                                 +0.7 Tcf
                                                           Residential
                                 5
  infrastructure required
                                                                 Other     +0.3 Tcf
  over next 5 Years              0
                                 2002 2004 2006 2008 2010 2012 2014

Source: CERA and FERC

                                                                                      6
Pipeline Group Overview
Leading Natural Gas Infrastructure
                                                   Key Statistics
                                                   ► 58,000 miles
                                                   ► 1/3 of daily U.S. throughput
                                                   ► 40% of U.S. growth capital
                                                     in 2005*

                                                   Distinguishing Features
                                                   ► Unmatched connectivity
                                          Elba
                                                   ► Superior market presence
                                          Island


                                                   ► Favorable recontracting
                                                     position
                                                   ► Outstanding growth potential


*Source: Energy Information Association


                                                                                    8
Connectivity Strength: Market

                                                                                                Catoosa Co.
                                                                                     Ringgold

                 75 SNG delivery
                 75 SNG delivery                                                                                                                     49 SNG delivery
                     points to                                                                                                                    49 SNG delivery
                                                                                                     Calhoun
                    points to                                                                                                                           points to
                                                                                                           Chatsworth
                    Alagasco                                                                                                                         points to
                    Alagasco                                                                                                                              AGL
                                                                                       Rome

                                                                                                                                                       AGL
                                                                          Gadsden       Cedartown/
                                                                                                               Marietta
                                                               Lincoln                  Rockmart
                                                                                                      Dallas

                                              Jasper                                                                 Ben Hill
                              Oakman
                                                                  Pell City
                                                                                                                                                                                   Augusta
                                                                                                      Carrolton
                                                                                 Anniston
                                                                                                                                                           Warrenton
                                                  Birmingham                                                              South Atlanta
                                                                                                  Yates
                                                                          Talladega
                                                                                                                                                                          Blythe
                                                                                                     Newnan
                                                                         Oak Grove
                  Reform
                                                                                                                                     Bass Junction


 Intensive
                                          Tuscaloosa
                                                                                                                                                           Sandersville
                                                                                                           Thomaston
                     Greene Co.
                                                 Centerville                                                                              Macon
                                                                                     Opelika                                                           Danville
                                                                                                                      S. Thomaston
                                                                                                 Phenix City
                                                                          Eclectic                                                                        Dexter


 Connections                                                                                                                                                                            Springfield/
                 Demopolis
                                                                                                                                                  Laurens County                          Guyton
                                                                                                                                                     (South)
                                                                                     Tuskegee
                                                                                                                                                                                                       Savannah
                                                       Selma
                                  Uniontown                    Montgomery


     Citygates
 ►

     Plants
 ►                 SNG
                   SNG Delivery Points/Areas


                                                                                                                                                                                                                  9
Connectivity Strength: Supply


► Strong
  presence
► Hub-to-hub                                 ANR

  service                                    FGT
                                             SNG
                                             TGP
► Diversity
               Most GOM take away capacity


                                               10
El Paso’s Pipelines Unmatched for
Growth Projects
                                                   Why is this good?
                                                       Superior presence
                                                   ►

                                                        – Market
                                                        – Supply basins

                                                   Growth Capital
                                                   Commitment*
                                                       $586 MM 2004
                                                   ►

                                                       + $450 MM 2005
                                                   ►

                                                       ± $450 MM 2006–2008
                                                   ►


*In addition to ± $450 MM/year maintenance capex


                                                                           11
Production Company Overview
Early Culture Shifts/Focus Items
              Old                                New
     Basin dominance                 Best in basin
 ►                               ►

     Inadequate pre-investment       Consistent and disciplined risk
 ►                               ►
     analysis                        and reserve determination
     Poor portfolio management       Comprehensive mapping with
 ►                               ►
                                     life-of-property exploitation
                                     plans
     Deep exploration emphasis       Capital allocation to full risk
 ►                               ►
                                     spectrum
     Production growth through       Short-term focus on existing
 ►                               ►
     capex                           properties and base
                                     production. Long-term
                                     emphasis on value creation


                                                                       13
El Paso Production


   Well Positioned in Key U.S. Natural Gas Basins

                                                    14
Production Company Overview
                                                             Average Daily Production1
                                                                    (MMcfe/d)
       Production stabilized
  ►
                                                                                     860–9002
                                                       901
                                                                          810+2
                                                                  814
       Creating value at
  ►                                                                                        70   Equity
                                                                        24        Equity
       $4.75/MMBtu

       GOM, Onshore, and
  ►
       Brazil performing well

       Texas Gulf Coast
  ►
       developing low-risk
       inventory
                                                 1Q 2004         2004     2005E       2005 Exit

1Includes   volumes attributable to Four Star equity
2Assumes     no effects from Hurricane Katrina


                                                                                                         15
Dramatic Shift Towards
Onshore Production
                                             Key takeaways
                                             ► Onshore production almost
                                               doubles as percentage of total
                  International
                                             ► Business more predictable
                       8%
                                             ► R/P goes from 6.2 to 7.4
        Onshore
         25%           GOM
  GOM                              Onshore
                                             How was this accomplished?
                       25%
  41%                               47%
        TX Gulf
                                             ► Shifted capital towards Onshore
                         TX Gulf
         Coast
                                               mid-2004
                          Coast
          34%              20%
                                             ► Successful drilling program
                                             ► Medicine Bow accelerates
   1Q 2004              2005E Exit
                                               process
                                                – 80% proved reserves in core
                                                  Onshore areas


                                                                                16
Texas Gulf Coast
Turnaround Well Underway
          Problems                     Response
     Focused on deep,              New management
 ►                             ►
     expensive wells               Changed risk profile
                               ►
     Generally 100% working
 ►                                 Success measured by
                               ►
     interest                      PVR
     Success defined by high
 ►                                 Building inventory of
                               ►
     flow rates                    low-risk prospects
     Wheels came off in 2003
 ►                                 Leveraging large
                               ►
                                   acreage position

 Situation analogous to successful GOM turnaround


                                                           17
Creating More Value in
Shallower Objectives

                                                                                     Historical focus was
                                                                                 ►
Frio
                                                                                     lower Vicksburg
► Well cost: $1.3 MM
► Reserves: 1.1 Bcfe
► F&D costs: ≈ $1.18 Mcfe
                                                                                     Multi-pay
                                                                                 ►
                                                                                     environment offers
                                                                       8,500'
Upper Vicksburg
                                                                                     attractive, shallower
► Well cost: $1.7 MM
► Reserves: 2.0 Bcfe                                                                 options
► F&D costs: ≈ $0.85 Mcfe

                                                                       12,000'
                                                                                     PVR increases from
                                                                                 ►
Lower Vicksburg
                                                                                     1.2 to 2.1
► Well cost: $7.6 MM
► Reserves: 5.3 Bcfe
► F&D costs: ≈ $1.43 Mcfe
                                                                       19,000'
Note: Estimates based on per       Sand   Resistivity (HC Indicator)
well data for a South Texas well


                                                                                                        18
Good Progress in Texas Gulf Coast
                            Monte Christo Field
                  Hidalgo
                                                         Early returns very good
                                                     ►


                                                         El Paso has ≈ 200,000 net acre
                                                     ►
                                                         position to evaluate/leverage

                                                         Expect solid inventory for
                                                     ►
                                    Operated wells
                                                         2006 capital program
                                    2005 wells
    Jeffress/Samano Field           2006 wells
                                    EP leases


                                                                                  Initial
                                                                    Capex      Production
                                                                    ($ MM)      (MMcf/d)
                                        Field         Formation
     Hamman Ranch 361               Monte Christo    U. Vicksburg    $1.0          6.1
     Hamman Ranch 471               Monte Christo    U. Vicksburg    $0.9          9.5
     Hamman Ranch 601               Monte Christo    L. Vicksburg    $2.3         11.0
     Salinas M 03                   Jeffress         L. Vicksburg    $2.1          3.4
                                                                                   1.22
     Hamman Ranch 71                Monte Christo    U. Vicksburg    $1.8
     Renger 2                       Speaks           L. Wilcox       $5.3         15.0
     Saga 1                         La Copita        U. Vicksburg    $3.0      Completing;
                                                                             sets up 3 offsets
     1Recompletions
     2Testing continuing

                                                                                                 19
Production Company Summary

    Very confident in completing E&P turnaround
►

    Program creating value at plan prices
►

    Business becoming more predictable
►

    – More onshore production
    – Longer R/P
    Strong outlook for 2006
►


                                                  20
Outlook for 2006
Substantial Leverage to
Natural Gas & Oil Prices
                                                                       Potential 2006 Impact
 Assumed Gas
                   $5      $6       $7       $8       $9      $10
 Price $/MMBtu

                                                              $2,891
                                                     $2,649
                                            $2,377
                                                                               $10 gas price
                               $2,105
                 $1,803 $1,953
                                                                             implies $670 MM
                                                                            incremental cash
         $ MM
      Revenue                                                                     vs. $5


                                                                       Current
Cash Loss from


                                                                        Strip
                  ($90)   ($173)
Legacy Hedges                      ($257)   ($341)   ($424)   ($508)


        Assumptions: 330 Bcfe*; 10% basis differential and oil priced at 6x gas

*For illustrative purposes: Will provide 2006 guidance in January; assumes high end
 of 2005 exit rate

                                                                                               22
Cost Reductions Continue

    Greenway lease’s approximately $50 MM annual costs
►
    ending in 2007
    Political risk insurance cost which peaked at more than
►
    $25 MM per year essentially eliminated with sale of
    foreign assets
    D&O insurance annual expense of $29 MM reduced by
►
    nearly one-half after 2005
    Outside legal costs of approximately $55 MM per year
►
    expected to come down in 2006 and down sharply in 2007
    Accounting and audit annual costs of $45 MM to be trimmed
►
    by one-third after 2005
    Trading costs reduce as book continues to shrink
►


                                                                23
Summary

    El Paso has made rapid progress
►


    Pipelines performing great; outlook great
►


    Production turnaround complete by year end
►


    Shaping up for a great 2006
►


                                                 24
Appendix
Production Related
Derivative Schedule
                                       2005                            2006                       2007                2008             2009-2012
                                      Average                     Average                     Average            Average            Average
                            Notional   Hedge    Average Notional   Hedge    Average Notional   Hedge   Notional   Hedge   Notional   Hedge
Natural Gas                 Volume      Price  Cash Price Volume    Price  Cash Price Volume    Price  Volume      Price  Volume      Price
                             (Bcf)   ($/MMBtu) ($/MMBtu)   (Bcf) ($/MMBtu) ($/MMBtu)   (Bcf) ($/MMBtu)  (Bcf)   ($/MMBtu)  (Bcf)   ($/MMBtu)
Designated
   Fixed Price - Legacy 1      32.60   $6.79      $3.64        83.7       $6.36      $3.93      4.6      $3.28       4.6      $3.42   16.0     $3.74
   Fixed Price                  0.50   $5.78      $5.78         1.8       $5.28      $5.28      0.8      $5.23
Economic
   Fixed Price                  6.10   $8.05      $8.05        24.7       $8.11      $8.11
   Ceiling                                                     60.0       $9.50      $9.50     21.0      $9.00      18.0     $10.00   16.8     $8.75
   Floor                       18.00   $6.00      $6.00       120.0       $7.00      $7.00     21.0      $7.00      18.0      $6.00   16.8     $6.00
                                                                                               30.0      $6.00

                                       2005                            2006                       2007                2008
                                     Average                     Average                     Average           Average
                            Notional  Hedge    Average Notional   Hedge    Average Notional   Hedge   Notional  Hedge
Oil                          Volume    Price  Cash Price Volume    Price  Cash Price Volume    Price   Volume    Price
                            (MMBbl) ($/MMBtu) ($/MMBtu) (MMBbl) ($/MMBtu) ($/MMBtu) (MMBbl) ($/MMBtu) (MMBbl) ($/MMBtu)
Designated
   Fixed Price                   0.1   $35.15    $35.15         0.4   $35.15      $35.15        0.2   $35.15
Economic
   Fixed Price                   0.2   $59.20    $59.20         1.0   $58.81      $58.81
   Ceiling                                                                                      1.0   $60.38         0.9   $57.03
   Floor                                                                                        1.0   $55.00         0.9   $55.00


See El Paso’s form 10-Q filed 8/5/05 and form 10-K/A filed 6/15/05 for additional information on the company’s derivative activity
1Hedge  price and cash price are identical for 2007–2012
Note: As of August 30, 2005


                                                                                                                                                   26
Doug Foshee
President and Chief Executive Officer
Banc of America
Annual Investor Conference
September 20, 2005
                              the place to work
                         the neighbor to have
                          the company to own

More Related Content

el paso 092005Foshee_BOA

  • 1. Doug Foshee President and Chief Executive Officer Banc of America Annual Investor Conference September 20, 2005 the place to work the neighbor to have the company to own
  • 2. Cautionary Statement Regarding Forward-looking Statements This presentation includes forward-looking statements and projections, made in reliance on the safe harbor provisions of the Private Securities Litigation Reform Act of 1995. The company has made every reasonable effort to ensure that the information and assumptions on which these statements and projections are based are current, reasonable, and complete. However, a variety of factors could cause actual results to differ materially from the projections, anticipated results or other expectations expressed in this presentation, including, without limitation, our ability to implement and achieve our objectives in the long- range plan, including achieving our debt-reduction targets; our ability to obtain necessary governmental approvals for proposed pipeline projects and our ability to successfully construct and operate such projects; our ability to meet production volume targets in our Production segment; uncertainties associated with exploration and production activities; our ability to successfully execute, manage, and integrate acquisitions; our ability to close our announced asset sales on a timely basis; changes in commodity prices for oil, natural gas, and power; general economic and weather conditions in geographic regions or markets served by the company and its affiliates, or where operations of the company and its affiliates are located; the uncertainties associated with governmental regulation; political and currency risks associated with international operations of the company and its affiliates; competition; and other factors described in the company’s (and its affiliates’) Securities and Exchange Commission filings. While the company makes these statements and projections in good faith, neither the company nor its management can guarantee that anticipated future results will be achieved. Reference must be made to those filings for additional important factors that may affect actual results. The company assumes no obligation to publicly update or revise any forward-looking statements made herein or any other forward-looking statements made by the company, whether as a result of new information, future events, or otherwise. 2
  • 3. Our Purpose El Paso Corporation provides natural gas and related energy products in a safe, efficient, and dependable manner 3
  • 4. El Paso Overview Premier natural gas pipeline franchise ► One of largest independent producers ► – Turnaround almost complete Significant leverage to favorable commodity ► fundamentals Excellent progress on asset sales/debt ► reduction 4
  • 5. Significant Progress in Turnaround December 2003 Current Liquidity Stressed Strong ► ► ► Net debt $20.5 billion $15.9 billion* ► ► ► Asset sales Long-Range Plan (LRP) goal: $4.3 billion sold under LRP ► ► ► $3.3 billion–$3.9 billion Incremental goal: $1.4 billion announced or ► ► $1.2 billion–$1.6 billion closed Pipes, E&P, marketing & Pipes, E&P, marketing (out of ► ► Range of businesses ► trading, petroleum, chemical, or exiting all other) domestic & international power, midstream, others Large corporate center Small corporate center—push ► ► Corporate structure ► functions to businesses 5 divisions ► 2 divisions ► *As of June 30, 2005 5
  • 6. U.S. Natural Gas Market Macro Overview Consumption & Supply in Tcf Demand Growth Domestic ► Gas consumption in the 2004–2014 35 supply power sector will grow 30 substantially +5.0 Tcf 25 – 200 GWs of gas-fired Power Generation generating capacity built 20 since 2000 +1.0 Tcf Industrial ► Domestic supply grows 15 slowly +0.4 Tcf Commercial 10 ► More than $20 billion in +0.7 Tcf Residential 5 infrastructure required Other +0.3 Tcf over next 5 Years 0 2002 2004 2006 2008 2010 2012 2014 Source: CERA and FERC 6
  • 8. Leading Natural Gas Infrastructure Key Statistics ► 58,000 miles ► 1/3 of daily U.S. throughput ► 40% of U.S. growth capital in 2005* Distinguishing Features ► Unmatched connectivity Elba ► Superior market presence Island ► Favorable recontracting position ► Outstanding growth potential *Source: Energy Information Association 8
  • 9. Connectivity Strength: Market Catoosa Co. Ringgold 75 SNG delivery 75 SNG delivery 49 SNG delivery points to 49 SNG delivery Calhoun points to points to Chatsworth Alagasco points to Alagasco AGL Rome AGL Gadsden Cedartown/ Marietta Lincoln Rockmart Dallas Jasper Ben Hill Oakman Pell City Augusta Carrolton Anniston Warrenton Birmingham South Atlanta Yates Talladega Blythe Newnan Oak Grove Reform Bass Junction Intensive Tuscaloosa Sandersville Thomaston Greene Co. Centerville Macon Opelika Danville S. Thomaston Phenix City Eclectic Dexter Connections Springfield/ Demopolis Laurens County Guyton (South) Tuskegee Savannah Selma Uniontown Montgomery Citygates ► Plants ► SNG SNG Delivery Points/Areas 9
  • 10. Connectivity Strength: Supply ► Strong presence ► Hub-to-hub ANR service FGT SNG TGP ► Diversity Most GOM take away capacity 10
  • 11. El Paso’s Pipelines Unmatched for Growth Projects Why is this good? Superior presence ► – Market – Supply basins Growth Capital Commitment* $586 MM 2004 ► + $450 MM 2005 ► ± $450 MM 2006–2008 ► *In addition to ± $450 MM/year maintenance capex 11
  • 13. Early Culture Shifts/Focus Items Old New Basin dominance Best in basin ► ► Inadequate pre-investment Consistent and disciplined risk ► ► analysis and reserve determination Poor portfolio management Comprehensive mapping with ► ► life-of-property exploitation plans Deep exploration emphasis Capital allocation to full risk ► ► spectrum Production growth through Short-term focus on existing ► ► capex properties and base production. Long-term emphasis on value creation 13
  • 14. El Paso Production Well Positioned in Key U.S. Natural Gas Basins 14
  • 15. Production Company Overview Average Daily Production1 (MMcfe/d) Production stabilized ► 860–9002 901 810+2 814 Creating value at ► 70 Equity 24 Equity $4.75/MMBtu GOM, Onshore, and ► Brazil performing well Texas Gulf Coast ► developing low-risk inventory 1Q 2004 2004 2005E 2005 Exit 1Includes volumes attributable to Four Star equity 2Assumes no effects from Hurricane Katrina 15
  • 16. Dramatic Shift Towards Onshore Production Key takeaways ► Onshore production almost doubles as percentage of total International ► Business more predictable 8% ► R/P goes from 6.2 to 7.4 Onshore 25% GOM GOM Onshore How was this accomplished? 25% 41% 47% TX Gulf ► Shifted capital towards Onshore TX Gulf Coast mid-2004 Coast 34% 20% ► Successful drilling program ► Medicine Bow accelerates 1Q 2004 2005E Exit process – 80% proved reserves in core Onshore areas 16
  • 17. Texas Gulf Coast Turnaround Well Underway Problems Response Focused on deep, New management ► ► expensive wells Changed risk profile ► Generally 100% working ► Success measured by ► interest PVR Success defined by high ► Building inventory of ► flow rates low-risk prospects Wheels came off in 2003 ► Leveraging large ► acreage position Situation analogous to successful GOM turnaround 17
  • 18. Creating More Value in Shallower Objectives Historical focus was ► Frio lower Vicksburg ► Well cost: $1.3 MM ► Reserves: 1.1 Bcfe ► F&D costs: ≈ $1.18 Mcfe Multi-pay ► environment offers 8,500' Upper Vicksburg attractive, shallower ► Well cost: $1.7 MM ► Reserves: 2.0 Bcfe options ► F&D costs: ≈ $0.85 Mcfe 12,000' PVR increases from ► Lower Vicksburg 1.2 to 2.1 ► Well cost: $7.6 MM ► Reserves: 5.3 Bcfe ► F&D costs: ≈ $1.43 Mcfe 19,000' Note: Estimates based on per Sand Resistivity (HC Indicator) well data for a South Texas well 18
  • 19. Good Progress in Texas Gulf Coast Monte Christo Field Hidalgo Early returns very good ► El Paso has ≈ 200,000 net acre ► position to evaluate/leverage Expect solid inventory for ► Operated wells 2006 capital program 2005 wells Jeffress/Samano Field 2006 wells EP leases Initial Capex Production ($ MM) (MMcf/d) Field Formation Hamman Ranch 361 Monte Christo U. Vicksburg $1.0 6.1 Hamman Ranch 471 Monte Christo U. Vicksburg $0.9 9.5 Hamman Ranch 601 Monte Christo L. Vicksburg $2.3 11.0 Salinas M 03 Jeffress L. Vicksburg $2.1 3.4 1.22 Hamman Ranch 71 Monte Christo U. Vicksburg $1.8 Renger 2 Speaks L. Wilcox $5.3 15.0 Saga 1 La Copita U. Vicksburg $3.0 Completing; sets up 3 offsets 1Recompletions 2Testing continuing 19
  • 20. Production Company Summary Very confident in completing E&P turnaround ► Program creating value at plan prices ► Business becoming more predictable ► – More onshore production – Longer R/P Strong outlook for 2006 ► 20
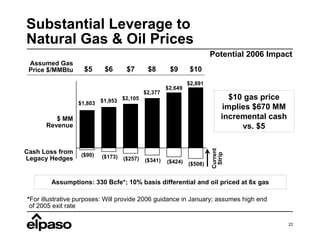
  • 22. Substantial Leverage to Natural Gas & Oil Prices Potential 2006 Impact Assumed Gas $5 $6 $7 $8 $9 $10 Price $/MMBtu $2,891 $2,649 $2,377 $10 gas price $2,105 $1,803 $1,953 implies $670 MM incremental cash $ MM Revenue vs. $5 Current Cash Loss from Strip ($90) ($173) Legacy Hedges ($257) ($341) ($424) ($508) Assumptions: 330 Bcfe*; 10% basis differential and oil priced at 6x gas *For illustrative purposes: Will provide 2006 guidance in January; assumes high end of 2005 exit rate 22
  • 23. Cost Reductions Continue Greenway lease’s approximately $50 MM annual costs ► ending in 2007 Political risk insurance cost which peaked at more than ► $25 MM per year essentially eliminated with sale of foreign assets D&O insurance annual expense of $29 MM reduced by ► nearly one-half after 2005 Outside legal costs of approximately $55 MM per year ► expected to come down in 2006 and down sharply in 2007 Accounting and audit annual costs of $45 MM to be trimmed ► by one-third after 2005 Trading costs reduce as book continues to shrink ► 23
  • 24. Summary El Paso has made rapid progress ► Pipelines performing great; outlook great ► Production turnaround complete by year end ► Shaping up for a great 2006 ► 24
  • 26. Production Related Derivative Schedule 2005 2006 2007 2008 2009-2012 Average Average Average Average Average Notional Hedge Average Notional Hedge Average Notional Hedge Notional Hedge Notional Hedge Natural Gas Volume Price Cash Price Volume Price Cash Price Volume Price Volume Price Volume Price (Bcf) ($/MMBtu) ($/MMBtu) (Bcf) ($/MMBtu) ($/MMBtu) (Bcf) ($/MMBtu) (Bcf) ($/MMBtu) (Bcf) ($/MMBtu) Designated Fixed Price - Legacy 1 32.60 $6.79 $3.64 83.7 $6.36 $3.93 4.6 $3.28 4.6 $3.42 16.0 $3.74 Fixed Price 0.50 $5.78 $5.78 1.8 $5.28 $5.28 0.8 $5.23 Economic Fixed Price 6.10 $8.05 $8.05 24.7 $8.11 $8.11 Ceiling 60.0 $9.50 $9.50 21.0 $9.00 18.0 $10.00 16.8 $8.75 Floor 18.00 $6.00 $6.00 120.0 $7.00 $7.00 21.0 $7.00 18.0 $6.00 16.8 $6.00 30.0 $6.00 2005 2006 2007 2008 Average Average Average Average Notional Hedge Average Notional Hedge Average Notional Hedge Notional Hedge Oil Volume Price Cash Price Volume Price Cash Price Volume Price Volume Price (MMBbl) ($/MMBtu) ($/MMBtu) (MMBbl) ($/MMBtu) ($/MMBtu) (MMBbl) ($/MMBtu) (MMBbl) ($/MMBtu) Designated Fixed Price 0.1 $35.15 $35.15 0.4 $35.15 $35.15 0.2 $35.15 Economic Fixed Price 0.2 $59.20 $59.20 1.0 $58.81 $58.81 Ceiling 1.0 $60.38 0.9 $57.03 Floor 1.0 $55.00 0.9 $55.00 See El Paso’s form 10-Q filed 8/5/05 and form 10-K/A filed 6/15/05 for additional information on the company’s derivative activity 1Hedge price and cash price are identical for 2007–2012 Note: As of August 30, 2005 26
  • 27. Doug Foshee President and Chief Executive Officer Banc of America Annual Investor Conference September 20, 2005 the place to work the neighbor to have the company to own