ESTIMATION OF RISK, IS THERE AN ASSOCIATIONPSM.pptx
•Download as PPTX, PDF•
0 likes•16 views
estimation of risk
Report
Share


ESTIMATION OF RISK, IS THERE AN ASSOCIATIONPSM.pptx
- 1. Estimating Risk : Is There an Association
- 2. LEARNING OBJECTIVE • To explore the concept of absolute risk. • To introduce and compare relative risk and odds ratio as measures of association between an exposure and a disease. • To calculate and interpret a relative risk in a cohort study. • To calculate and interpret an odds ratio in a cohort study and in a case-control study and to describe when the odds ratio is a good estimate of the relative risk. • To calculate and interpret an odds ratio in a matched-pairs case-control study.
- 3. BASIC STUDY DESIGNS IN EPIDEMIOLOGIC INVESTIGATIONS
- 4. BASIC STUDY DESIGNS IN EPIDEMIOLOGIC INVESTIGATIONS
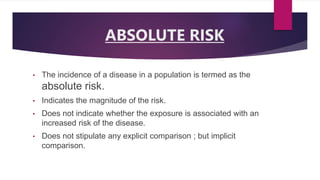
- 5. ABSOLUTE RISK • The incidence of a disease in a population is termed as the absolute risk. • Indicates the magnitude of the risk. • Does not indicate whether the exposure is associated with an increased risk of the disease. • Does not stipulate any explicit comparison ; but implicit comparison.
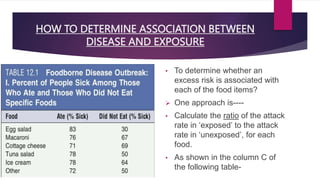
- 6. HOW TO DETERMINE ASSOCIATION BETWEEN DISEASE AND EXPOSURE • Eg:-Results of an investigation of a foodborne disease outbreak. • Suspect foods were identified ; • For each food, the attack rate of the disease for those who ate the food(exposed) • The attack rate for those who didn’t eat the food(unexposed)
- 7. HOW TO DETERMINE ASSOCIATION BETWEEN DISEASE AND EXPOSURE • To determine whether an excess risk is associated with each of the food items? One approach is---- • Calculate the ratio of the attack rate in ‘exposed’ to the attack rate in ‘unexposed’, for each food. • As shown in the column C of the following table-
- 8. HOW TO DETERMINE ASSOCIATION BETWEEN DISEASE AND EXPOSURE
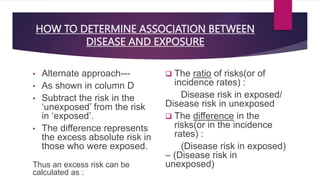
- 9. HOW TO DETERMINE ASSOCIATION BETWEEN DISEASE AND EXPOSURE • Alternate approach--- • As shown in column D • Subtract the risk in the ‘unexposed’ from the risk in ‘exposed’. • The difference represents the excess absolute risk in those who were exposed. Thus an excess risk can be calculated as : The ratio of risks(or of incidence rates) : Disease risk in exposed/ Disease risk in unexposed The difference in the risks(or in the incidence rates) : (Disease risk in exposed) – (Disease risk in unexposed)
- 10. DIFFERENCE IN BOTH THE WAYS OF CALCULATION Does the method that we choose to calculate excess risk make any difference? Another example-Two communities, A and B. Incidence if a disease in exposed in A is 40% ; In unexposed-10% Ratio of the rates= 4.0 Difference in incidence rates=30%. Similarly in B- Ratio -> 90/60=1.5
- 11. RELATIVE RISK • Both case control and cohort studies designed to determine if there is an association between exposure and disease. • As per Cohort study, question would be- • Relative risk = Risk in exposed/Risk in unexposed • It can also be defined as • Probability of an event occurring in exposed people compared with the probability of the event in unexposed people ; as the ratio of these two probabilities.
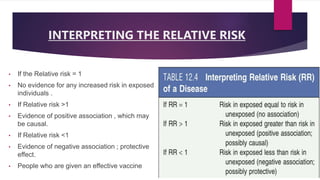
- 12. INTERPRETING THE RELATIVE RISK • If the Relative risk = 1 • No evidence for any increased risk in exposed individuals . • If Relative risk >1 • Evidence of positive association , which may be causal. • If Relative risk <1 • Evidence of negative association ; protective effect. • People who are given an effective vaccine
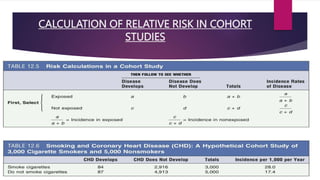
- 13. CALCULATION OF RELATIVE RISK IN COHORT STUDIES
- 14. CALCULATION OF RELATIVE RISK IN COHORT STUDIES
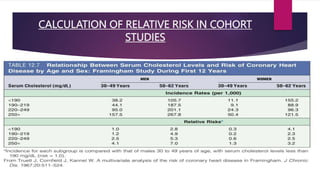
- 15. RELATIVE RISK : EXAMPLE
- 16. RELATIVE RISK : EXAMPLE • This Fig shows the data based on merging 2,282 middle aged men followed for 10yrs in the Framingham study • 1,838 middle aged men followed for 8years in Albany, New York. • Data relate smoking, cholesterol level, BP to risk of Myocardial Infarction and Death from CHD. • The value of 1 is assigned to the LOWEST of the risk ; other risks are calculated relative to this figure. • Left pic- shows risk in non smoker with low cholesterol level(set to be as 1) • Both smoking and elevated cholesterol levels contribute to the risk of MI and death from CHD. • Right pic- Comparable analysis of BP and smoking
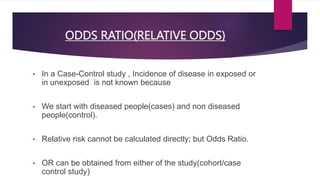
- 17. ODDS RATIO(RELATIVE ODDS) • In a Case-Control study , Incidence of disease in exposed or in unexposed is not known because • We start with diseased people(cases) and non diseased people(control). • Relative risk cannot be calculated directly; but Odds Ratio. • OR can be obtained from either of the study(cohort/case control study)
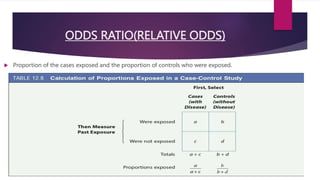
- 18. ODDS RATIO(RELATIVE ODDS) Proportion of the cases exposed and the proportion of controls who were exposed.
- 19. ODDS RATIO(RELATIVE ODDS) Odds = Probability that Epi Beauty will win the race/ Probability that Epi Beauty will lose the race P=Probability that Epi will win the race. 1-p= Probability that Epi Beauty will lose the race. Odds =p/1-p Probability of winning=60% Odds of winning=60%/40%= 1.5
- 20. ODDS RATIO IN COHORT AND CASE CONTROL STUDIES
- 21. INTERPRETING ODDS RATIO When is the ODDS ratio a good estimate of the Relative Risk
- 22. CALCULATION OF ODDS RATIO IN AN UNMATCHED CASE CONTROL STUDY
- 23. CALCULATION IN MATCHED PAIRS CASE CONTROL STUDY