


Experimental design cartoon part 5 sample size
- 2. Let’s move on to sample size determination How many samples do you need? I know this one! You always do 3 experiments! Am I right? Nope. OK, do you do experiments until your data are significant? No. You do a calculation before you start based on your hypothesis and experiment design
- 3. What if I am doing a descriptive study? Sample size calculations are for when you are formally testing a hypothesis Exploratory studies don’t need them, but without the stats to back up your data you won’t be able to make strong conclusions
- 4. Step 1: Identify your variables Step 2: Pick the right test (sounds scary, isn’t really) Step 3: Plug some numbers into a calculator Sample size calculations are actually not too hard… 3 steps
- 5. Let’s briefly talk about stats The good news is that you usually should be planning your experiment in a way that makes your stats as simple as possible To be able to calculate sample size you will need a good idea of what test you plan to run in the end Oh, dear! If your plan is complex, then you definitely should get some expert help Let’s have a quick look at some of the common tests Phew!
- 6. Before we move on, let’s consider an experiment where you have more than one hypothesis to test The sample size calculation you do will be based on the primary outcome measure I always consider the primary outcome to be the real reason I did the experiment How do I know which is the primary hypothesis? Secondary outcomes are bonus information, or details that help explain the data
- 7. Dependent/Outcome: What you actually measure Independent/Factor: The bits you control, how your samples are grouped Types of Variable Class of Variable Categorical: Discrete answers: yes/no, male/female, Small/medium/large Continuous: Answers can be anything Height, weight, age Speed, distance, power, concentration For your experiment, first identify what class your variables will fall into Then look up the type of test that is appropriate for those combinations Reminder For both types of variable, there are two classes: categorical and continuous Simple!
- 8. The tests that you decide to use will ultimately depend on whether your data are normally distributed or not You’ll need to formally test for normality once you have your data However, for the purposes of experimental design, I usually base my calculations on the data being normally distributed Normal Distribution Non-Normal Distribution This simplifies things and means you only need to choose between about half as many tests I’m not convinced I’m normal! OK, on to the tests!!
- 9. Outcome Variables: Factor Variables: Types of Variable Categorical Categorical Hypothesis: mice carrying the green transgene are more likely to be female than male Male Female Control Transgenic Example please! Chi Squared
- 10. Outcome Variables: Factor Variables: Types of Variable Categorical Categorical Male Female Control Transgenic 4 4 2 6 Chi squared will test how likely the observed proportions will have arisen by chance Your data is simply the number of animals in each group Chi Squared
- 11. Chi Squared Outcome Variables: Factor Variables: Types of Variable Categorical Categorical Male Female -/- You can use Chi square with multiple categories in both outcome and factor variables +/-+/+ Do you call those Chi rectangles? No, Conro!
- 12. Outcome Variables: Factor Variables: Types of Variable Categorical Weight Measurements -/- +/+ Continuous if you planned to compare the weights of your 2 transgenic lines I find it helps if you imagine the graphs your data will generate Example please! Note: use T tests for comparing 2 groups only! T tests
- 13. Outcome Variables: Factor Variables: Types of Variable Categorical Continuous: Independent or paired T test? If your groups are unrelated, then you will use the independent T test? Independent T tests
- 14. Outcome Variables: Factor Variables: Types of Variable Categorical Continuous: If you are measuring the response in the same individuals, use a paired T test A + Treatment 1 Measurement B + Baseline Reading 1 Baseline Reading 2 Treatment 2 Measurement A B Paired T tests
- 15. Outcome Variables: Factor Variables: Types of Variable Categorical Continuous T tests are good for comparing 2 groups, but if you are going to have 3 or more you’ll likely to need ANOVA These are pretty common: for example comparing wild- type, heterozygous and homozygous mice -/- +/- +/+ Or if you have untreated, control treatment(s) and test treatments ANOVA
- 16. Outcome Variables: Factor Variables: Types of Variable Categorical Continuous: Like for T tests, there are different types of ANOVA depending on whether your samples are independent of not A one-way ANOVA is for independent samples, like our mice line examples -/- +/- +/+ A B A repeated measures ANOVA is for multiple paired samples 1 way or repeated measures ANOVA
- 17. Outcome Variables: Factor Variables: Types of Variable Categorical Continuous If you break the factor variables into two , you will need a 2-way ANOVA For example, if you plan to analyse your data looking at genotype AND gender effects then you will need a 2-way ANOVA -/-+/-+/+ -/-+/-+/+ Male Female 2 way ANOVA
- 18. Outcome Variables: Factor Variables: Types of Variable Continuous Ok, let’s move on to situations where you are looking to see if your two variables are correlated Continuous OutcomeVariable The most common test here is Pearson’s regression or Pearson’s correlation Pearson’s Regression
- 19. Outcome Variables: Factor Variables: Types of Variable Categorical (usually binary) A different form of regression, the logistic regression is used for categorical outcome data with continuous factor data Continuous An example might be if you want to see if there is a correlation between the age of your donor and whether a disease is present or not Logistic Regression
- 20. Outcome Variables: Factor Variables: Types of Variable Multiple Continuous Last one (of the common ones!). The MANOVA Categorical This is a special type of ANOVA where you have more than one outcome variable Classic examples are when you are comparing lots of different mRNAs in the same sample Or lots of different clinical details in the same patient Gene 1 Gene 2 Gene 3 NB – all 3 genes measured in same animal MANOVA
- 21. Outcome Variables: Factor Variables: Types of Variable Multiple Continuous Categorical If you plan do multiple ANOVAs or T tests in this situation you will underestimate your sample size The MANOVA is specifically designed for these multiple comparison tests NB – all 3 genes measured in same animal Gene 1 Gene 2 Gene 3 MANOVA
- 22. Outcome Variables: Factor Variables: Types of Variable Multiple Continuous Categorical Having multiple comparisons will increase the sample size you need. This is another time for you to consider; do you really want to ask lots of questions? NB – all 3 genes measured in same animal Gene 1 Gene 2 Gene 3 MANOVA
- 23. Remember though when you do your power analysis it is based only on the primary outcome This means that you may only have one outcome variable as far as power analysis goes MANOVA Or ANOVA The secondary outcomes will not be as robustly tested, but you can still report the data. BUT, make it clear when you write up your results that you have not accounted for multiple comparisons for these variables Oh, no. I’m confused!
- 24. MANOVA Or ANOVA You’re doing a clinical trial of a new drug that decreases blood pressure Blood pressure measurements are your primary outcome Secondary outcomes might be other clinical measurements like heart rate, white cell count, reflexes, blood sugars etc. The secondary outcomes are interesting but you aren’t designing the trial to test them, they’re not part of your sample calculations. ANOVA is OK
- 25. MANOVA Or ANOVA However, if you need multiple variables to answer your question then you need a MANOVA
- 26. There are other tests for more complex designs, but get help for those! Time for you to do something! Chi Square T Test 1 way ANOVA Spearman Logistic MANOVA Outcome Factor Cat Cat Cat (2 only) Cat Cat Cat Con Con 2 way ANOVACat + CatCon Con Con Con Con 2+
- 27. Chi Square T Test 1 way ANOVA Spearman Logistic MANOVA Outcome Factor Cat Cat Cat (2 only) Cat Cat Cat Con Con 2 way ANOVACon Con Con Con Con 2+ Protein B expression is increased in more than 50% of squamous cell carcinoma cancers Paired normal and cancer tissues probed with antibodies against protein B. Compare staining intensity in the normal tissue against the cancer tissue from the same patient. Staining intensity scored as “reduced”, “same” or “increased” First identify the variables and classify them as categorical or continuous Outcome Variables: Factor Variables: Cat + Cat
- 28. Chi Square T Test 1 way ANOVA Spearman Logistic MANOVA Outcome Factor Cat Cat Cat (2 only) Cat Cat Cat Con Con 2 way ANOVACon Con Con Con Con 2+ Protein B expression is increased in more than 50% of squamous cell carcinoma cancers Paired normal and cancer tissues probed with antibodies against protein B. Compare staining intensity in the normal tissue against the cancer tissue from the same patient. Staining intensity scored as “reduced”, “same” or “increased” Outcome Variables: Factor Variables: Categorical: reduced/ same/ increase Categorical: Cancer / no cancer Cat + Cat
- 29. Chi Square T Test 1 way ANOVA Spearman Logistic MANOVA Outcome Factor Cat Cat Cat (2 only) Cat Cat Cat Con Con 2 way ANOVACon Con Con Con Con 2+ Protein B expression is increased in more than 50% of squamous cell carcinoma cancers paired normal and cancer tissues probed with antibodies against protein B. Compare staining intensity in the normal tissue against the cancer tissue from the same patient. Staining intensity scored as signal intensity 0-255 Let’s test the hypothesis in a different way Outcome Variables: Factor Variables: Cat + Cat
- 30. Chi Square T Test 1 way ANOVA Spearman Logistic MANOVA Outcome Factor Cat Cat Cat (2 only) Cat Cat Cat Con Con 2 way ANOVACon Con Con Con Con 2+ Protein B expression is increased in more than 50% of squamous cell carcinoma cancers paired normal and cancer tissues probed with antibodies against protein B. Compare staining intensity in the normal tissue against the cancer tissue from the same patient. Staining intensity scored as signal intensity 0-255 Outcome Variables: Factor Variables: Continuous Signal intensity Categorical: Cancer / no cancer Cat + Cat Paired T test
- 31. Chi Square T Test 1 way ANOVA Spearman Logistic MANOVA Outcome Factor Cat Cat Cat (2 only) Cat Cat Cat Con Con 2 way ANOVACon Con Con Con Con 2+ Protein B expression is increased in more than 50% of squamous cell carcinoma cancers Paired normal and cancer tissues probed with antibodies against protein B. Compare staining intensity in the normal tissue against the cancer tissue from the same patient. Staining intensity scored as signal intensity 0-255. We also want to determine if patients with high staining intensity have also developed metastasis Outcome Variables: Factor Variables: Let’s add a little more Cat + Cat
- 32. Chi Square T Test 1 way ANOVA Spearman Logistic MANOVA Outcome Factor Cat Cat Cat (2 only) Cat Cat Cat Con Con 2 way ANOVACon Con Con Con Con 2+ Protein B expression is increased in more than 50% of squamous cell carcinoma cancers Outcome Variables: Factor Variables: Continuous Signal intensity Categorical: No cancer / cancer no metastasis / cancer with metastasisCat + Cat Paired normal and cancer tissues probed with antibodies against protein B. Compare staining intensity in the normal tissue against the cancer tissue from the same patient. Staining intensity scored as signal intensity 0-255. We also want to determine if patients with high staining intensity have also developed metastasis
- 33. Chi Square T Test 1 way ANOVA Spearman Logistic MANOVA Outcome Factor Cat Cat Cat (2 only) Cat Cat Cat Con Con 2 way ANOVACatCon Con Con Con Con 2+ The mRNA for protein A is decreased and mRNA for protein B is increased In RNA extracted from squamous cell carcinoma tissue compared to RNA isolated normal skin Paired normal skin and cancer tissues obtained, RNA isolated and reverse transcribed to cDNA. Quantitative PCR used to determine abundance of mRNA for protein B and mRNA for protein A, measured relative to a reference transcript Outcome Variables: Factor Variables:
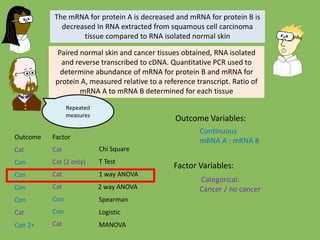
- 34. Chi Square T Test 1 way ANOVA Spearman Logistic MANOVA Outcome Factor Cat Cat Cat (2 only) Cat Cat Cat Con Con 2 way ANOVACatCon Con Con Con Con 2+ The mRNA for protein A is decreased and mRNA for protein B is decreased In RNA extracted from squamous cell carcinoma tissue compared to RNA isolated normal skin Paired normal skin and cancer tissues obtained, RNA isolated and reverse transcribed to cDNA. Quantitative PCR used to determine abundance of mRNA for protein B and mRNA for protein A, measured relative to a reference transcript Outcome Variables: Factor Variables: Continuous x 2 mRNA for Protein A mRNA for Protein B Categorical: Cancer / no cancer
- 35. Chi Square T Test 1 way ANOVA Spearman Logistic MANOVA Outcome Factor Cat Cat Cat (2 only) Cat Cat Cat Con Con 2 way ANOVACatCon Con Con Con Con 2+ The mRNA for protein A is decreased and mRNA for protein B is decreased In RNA extracted from squamous cell carcinoma tissue compared to RNA isolated normal skin Paired normal skin and cancer tissues obtained, RNA isolated and reverse transcribed to cDNA. Quantitative PCR used to determine abundance of mRNA for protein B and mRNA for protein A, measured relative to a reference transcript. Ratio of mRNA A to mRNA B determined for each tissue Outcome Variables: Factor Variables: You might be interested in the ratio of A to B rather than absolute levels of both
- 36. Chi Square T Test 1 way ANOVA Spearman Logistic MANOVA Outcome Factor Cat Cat Cat (2 only) Cat Cat Cat Con Con 2 way ANOVACatCon Con Con Con Con 2+ The mRNA for protein A is decreased and mRNA for protein B is decreased In RNA extracted from squamous cell carcinoma tissue compared to RNA isolated normal skin Paired normal skin and cancer tissues obtained, RNA isolated and reverse transcribed to cDNA. Quantitative PCR used to determine abundance of mRNA for protein B and mRNA for protein A, measured relative to a reference transcript. Ratio of mRNA A to mRNA B determined for each tissue Outcome Variables: Factor Variables: Continuous mRNA A : mRNA B Categorical: Cancer / no cancer Repeated measures
- 37. Chi Square T Test 1 way ANOVA Spearman Logistic MANOVA Outcome Factor Cat Cat Cat (2 only) Cat Cat Cat Con Con 2 way ANOVACatCon Con Con Con Con 2+ Squamous cell carcinoma cells induced to overexpress protein B display increased invasion compared with control treated cells. Squamous cell carcinoma cells will either be induced to express protein B, a control protein “C”, or not treated then seeded onto either a skin substitute or onto pure collagen. After 48 hours the distance migrated into each substrate will be measured Outcome Variables: Factor Variables: Last one!
- 38. Chi Square T Test 1 way ANOVA Spearman Logistic MANOVA Outcome Factor Cat Cat Cat (2 only) Cat Cat Cat Con Con 2 way ANOVACatCon Con Con Con Con 2+ Squamous cell carcinoma cells induced to overexpress protein B display increased invasion compared with control treated cells. Squamous cell carcinoma cells will either be induced to express protein B, a control protein “C”, or not treated then seeded onto either a skin substitute or onto pure collagen. After 48 hours the distance migrated into each substrate will be measured Outcome Variables: Factor Variables: Continuous distance migrated Categorical: Untreated, +Protein B or +control protein C Categorical: skin substitute or pure collagen
- 39. Right, now I know what test I am going to do, how do I decide on sample sizes! It’s quite easy actually! You can use an online calculators I like: www.powerandsamplesize.com Pick the appropriate test and fill in the details it asks for You’ll need to know some terms about what to put where so we’ll quickly cover the big ones and what they mean
- 40. It’s asking for a type I error rate, a What’s that? This is your critical p value written as a percentage P =0.05 = 5% This number represents the probability that you would have observed the effect even though no effect exists The P value will ultimately measure of how confident you can be that you haven’t got a false positive How likely is it that this difference could have occurred by chance?
- 41. Everyone uses p<0.05 right? So I want 5% here. 5% is a common cut off but it doesn’t mean it’s appropriate for your study! You might want 1% or even 0.1% if the impact of a false positive would be problematic such as in a drug safety trial How likely is it that this difference could have occurred by chance?
- 42. It’s asking for a Power, 1- b What’s that? The power refers to the false negative rate It’s the probability that you would have observed a difference if there actually is a difference This number is written as a fraction of 1 but usually described as a percentage So, 0.8 would be described as 80% power The higher the better for this number, but again make it fit your question. How likely is it that you could have detected a difference if there actually was one?
- 43. OK, back to the calculator. It’s asking for means and standard deviations Yes, the calculator needs a prediction for what you are going to see You’ll need two predictions: The effect size. What the means of your different populations will be Mean A Mean B Effect size A B And an estimate of the variation within each population Sample A Distribution curve
- 44. Let’s have a quick look at why you need those numbers, what they mean with respect to power and p values Mean A Mean B Effect size A B Sample A Distribution curve
- 45. Big Differences between populations Small variation within samples Small variation within samples Smaller Differences between populations Ideal situation: no overlap between groups. You can be quite confident that the result hasn’t occurred by chance Big Differences between population means Larger variation within samples If the difference between groups is small, or the variation is large you will be less confident about your interpretation. P values higher, less power
- 46. Big Differences between populations Small ariation between samples Small variation between samples Smaller Differences between populations The sample size calculator will tell you how many samples you will need to decrease your p value and increase your power to the limits that you have chosen Big Differences between population means Larger variation between samples Increased sample size The effect of increasing sample size decreases with each addition. There comes a point where adding samples is a waste of time, effort, money and ethically wrong
- 47. Where do the effect size and variation numbers come from? Look at all this juicy pilot data You could have a 1000 samples and see a really small difference but it might not matter in the grand scheme of things The effect size should be chosen not just on what you will be able to see but also based on real- world importance of the effect
- 48. Look at all this juicy pilot data Variation and predictions for effect size will ideally come from pilot data Sometimes this won’t be possible, in which case you should turn to published work You won’t be able to find your exact experiment but you should be able to find something similar enough to make a prediction
- 49. Hopefully you spotted an important point in the last little bit If you can reduce the variation between your experimental units, you will need less samples or be more confident with the same number of samples This is one of the goals of your pilot experiments. To get the experimental conditions as tight as possible so that you limit the variation between samples to true biological variability
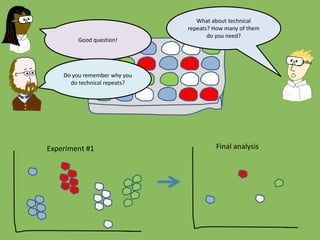
- 50. What about technical repeats? How many of them do you need? Good question! Do you remember why you do technical repeats? Experiment #1 Final analysis
- 51. They increase the accuracy of measurement for each sample Yes, by decreasing the intra- individual variability you should get a more accurate measurement Experiment #1 Final analysis Outliers or mistakes will have a smaller effect the more technical repeats you do There will therefore be less overall variability in your final sample numbers
- 52. So should I do as many as possible? Final analysis No, not necessarily, that would be a waste of time and money. You need to consider where the variability in your experiments will be and how much value each technical repeat adds Probably going to want examples here!
- 53. Paired normal and cancer tissues probed with antibodies against protein B. Compare staining intensity in the normal tissue against the cancer tissue from the same patient. Staining intensity scored as “reduced”, “same” or “increased” Protein B expression is increased in more than 50% of squamous cell carcinoma cancers The question to ask yourself is how variable will the data be when I test the same sample, and how does that compare to the between sample variability? Cancers vary a lot between individuals Our data should be pretty clear for each sample, though there will be variations within each sample It’s really a cost vs reward analysis. How much do each tech repeats cost (time, money and ethics) vs how much value they add Between Samples Variability Within sample Variability High Low Tech repeats Sample processing: low number OK Not much value from technical repeats, better to just increase sample numbers
- 54. The mRNA for protein A is decreased and mRNA for protein B is decreased In RNA extracted from squamous cell carcinoma tissue compared to RNA isolated normal skin Paired normal skin and cancer tissues obtained, RNA isolated and reverse transcribed to cDNA. Quantitative PCR used to determine abundance of mRNA for protein B and mRNA for protein A, measured relative to a reference transcript Here the samples are the same as last time, so again high inter-sample variability The technique this time also has more variability within it RNA degradation during storage, RNA isolation steps and pipetting errors during reverse transcription and qPCR So, we know we will need a large number of samples Between Samples Variability Within sample Variability High High So we probably need more technical repeats as well
- 55. The mRNA for protein A is decreased and mRNA for protein B is decreased In RNA extracted from squamous cell carcinoma tissue compared to RNA isolated normal skin Paired normal skin and cancer tissues obtained, RNA isolated and reverse transcribed to cDNA. Quantitative PCR used to determine abundance of mRNA for protein B and mRNA for protein A, measured relative to a reference transcript Between Samples Variability Within sample Variability High Sample availability might mean we don’t have the opportunity to repeat at the whole tissue level High But, logistically, there might be challenges You want the repeats to address the areas with the highest variability: the tissue extraction level Tech repeats Sample processing + RT-PCR and qPCR
- 56. Between Samples Variability Within sample Variability Tech repeats Squamous cell carcinoma cells induced to overexpress protein B display increased invasion compared with control treated cells. Squamous cell carcinoma cells will either be induced to express protein B, a control protein “C”, or not treated then seeded onto either a skin substitute. After 48 hours the distance migrated into each substrate will be measured Let’s assume here you are using cells from only one donor (e.g. an immortalised cell line) So variability will come from what condition the cells are in And maybe different levels of protein expression Med
- 57. Between Samples Variability Within sample Variability Tech repeats Squamous cell carcinoma cells induced to overexpress protein B display increased invasion compared with control treated cells. Squamous cell carcinoma cells will either be induced to express protein B, a control protein “C”, or not treated then seeded onto a skin substitute. After 48 hours the distance migrated into each substrate will be measured The assay itself should be quite tight. You will have the option of measuring lots of cells Med Probably don’t need many technical repeats per assay, rather doing more biological repeats would be a better use of resources Low Low
- 58. Between Samples Variability Within sample Variability Tech repeats Note that you might disagree with some of the previous assertions And really, it will be your data that tells you what you need to do But be aware, that adding lots of technical repeats may not be worth the time and money you invest in doing them OK, got it.
- 59. Ethics, Cost and Feasibility Once you have done your sample size calculation you have three important decisions to make
- 60. Ethics, Cost and Feasibility 1. Can I ethically justify using these numbers of patients/animals? • Does the end justify the means? • Will I be able to obtain ethical approval?
- 61. Ethics, Cost and Feasibility 2. Can I afford to process that number of samples?
- 62. Ethics, Cost and Feasibility 3. Is it feasible to process that number of samples? • Will I be able to recruit enough participants? • Will I be able to do the experiments within my study timeframe?
- 63. Ethics, Cost and Feasibility What do you do if the answer to these questions is no? Well, first you should be pleased that you asked the question before wasting loads of time doing the experiment! Secondly you can go back and see if you can tighten up your research question or modify your experimental design
- 64. Ethics, Cost and Feasibility You can reduce the number of samples required by: Reducing variability in your samples, possibly by controlling for confounders Or, reducing the number of comparisons being made. Remember, its better to answer one question well rather than adding lots of extra small questions
- 65. Final Checks
- 66. Don’t jump in too soon! 3 final questions 1. Consider the ethics again. Are you fully satisfied that you are going to do the least amount of harm to effectively answer your question?
- 67. 2. What would the devil’s advocate say about your experimental design? Are your controls sufficient to rule out alternative interpretations? Is your randomisation technique truly random? Are your experimental units truly independent?
- 68. 3. Have you had someone else’s input? Before you jump in, get someone independent to have a look. They might come up with additional confounders or spot ways where you can generate more robust data
- 69. It’s worth spending time on experimental planning Making sure things are right will help make sure you generate useful data Hopefully this series of videos should have helped you identify what to think about.
- 70. Part 5 Recap. Don’t be put off by sample size determination. It will stop you wasting time and money with poorly planned experiments Identify whether your variables are continuous or categorical, and the rest is easy. Use your pilot studies to reduce variabilities in your experiment and to provide the numbers you need to perform power analysis Don’t be afraid to redesign your experiment if you have any qualms about research ethics or the likelihood of generating meaningful data.