


Financial statement analysis
- 1. Financial Statements Balance Sheet Income Statement Managers and Analysts Use Financial Statement to Conduct: - Cash Flow Analysis - Performance (Ratio) Analysis
- 2. The Link Between the Balance Sheets and the Income Statement. 1999 2000 2000
- 3. Accounting Profits and Cash Flows •Are Accounting Profits and cash Flows same? • Why Accounting Profits and Cash Flows Differ – Revenue Recognition – The Matching Principle – Depreciation
- 4. Translating Accounting Profits into Cash Flows • The statement is based on three cash flow categories: Cash flow from operations is net income adjusted for depreciation and changes in receivables, payables, and inventories.
- 5. Translating Accounting Profits into Cash Flows Cash flow from investing activities arise from the purchase and sale of marketable securities and productive assets such as machinery. Cash flow from financing activities include the repayment of debt, the payment of dividends, and the issuance of new securities.
- 6. Sources And Uses Of Cash • Sources of cash – Operations—customers pay invoices – Investing—firm sells assets – Financing—firm borrows or issues new shares • Uses of cash – Operations—pay its suppliers – Investing—capital expenditures – Financing—interest and dividend payments
- 7. Sources of Cash Inflow and Cash Outflow.
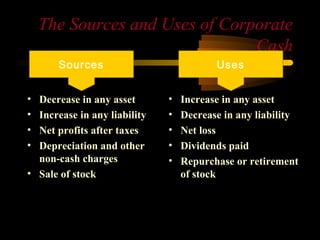
- 8. The Sources and Uses of Corporate Cash Sources Uses • Decrease in any asset • Increase in any asset • Increase in any liability • Decrease in any liability • Net profits after taxes • Net loss • Depreciation and other • Dividends paid non-cash charges • Repurchase or retirement • Sale of stock of stock
- 9. Key Measures of Cash Flow Cash Flow from • Total Cash Generated Operations Operating • Cash Flow Before Repaying Cash Flow Lenders Free Cash • Cash Flow Firm Could Flow Distribute to Investors 12
- 10. FINANCIAL STATEMENT ANALYSIS
- 11. Objectives of Analysis • The adequacy or otherwise of the profits earned • The adequacy or otherwise of the financial strength • Its ability to generate enough cash and cash equivalents, their timing and certainty • The future growth outlook
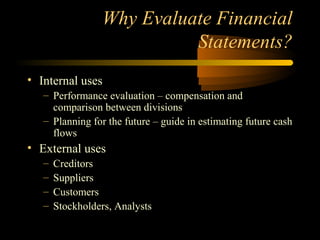
- 12. Why Evaluate Financial Statements? • Internal uses – Performance evaluation – compensation and comparison between divisions – Planning for the future – guide in estimating future cash flows • External uses – Creditors – Suppliers – Customers – Stockholders, Analysts
- 13. The Tool Kit • Multi – Step Income Statement • Horizontal Analysis • Common-Sized Analysis • Trend Analysis • Analytical Balance Sheet • Ratio Analysis • Cash flow Analysis
- 14. Multi-step Income Statement • GP • PBDIT • OP / PBIT • PBTEOT • PBT • PAT
- 16. Ratio Analysis • RoI Ratios • Solvency Ratios • Liquidity ratios • Turnover Ratios • Profitability Ratios • Market Ratios • Dupont Analysis
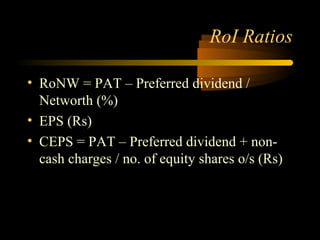
- 17. RoI Ratios • RoNW = PAT – Preferred dividend / Networth (%) • EPS (Rs) • CEPS = PAT – Preferred dividend + non- cash charges / no. of equity shares o/s (Rs)
- 18. Solvency Ratios • NAV / NWPS / BVPS (Rs) • DER • Interest cover = PAT + Int (LTD) + non- cash charges / int (LTD) – Times • DSCR = PAT + Int (LTD) + non-cash charges / int (LTD) + principal repayment – Times
- 19. Liquidity ratios • CR = CAs, loans and advances + ST Inv / CLs + provisions + ST debt • QR • CP allowed to customers = receivables x 365 / credit sales • Supplier’s credit = payables x 365 / credit purchases • Inventory holding period = inventory x 365 / COGS
- 20. Turnover Ratios • FATO = Net sales / fixed assets • NWTO = Net sales / NW • Debtor turnover • Inventory turnover
- 21. Profitability Ratios • Multi-step profit margins • Ratios of individual costs and expenses to sales • Ratios of other income, extraordinary items and prior year adjustments to PBT and/or net sales
- 22. The DuPont Model Brings together: • Profitability • Efficiency • Leverage
- 23. Deriving the Du Pont Identity • ROE = NI / TE • Multiply by 1 and then rearrange – ROE = (NI / TE) (TA / TA) – ROE = (NI / TA) (TA / TE) = ROA * EM • Multiply by 1 again and then rearrange – ROE = (NI / TA) (TA / TE) (Sales / Sales) – ROE = (NI / Sales) (Sales / TA) (TA / TE) – ROE = PM * TAT * EM
- 24. Du Pont Analysis Net Income Sales Assets Return on equity = Sales Asset Shareholder’s Equity Net Total Equity Profit Asset Multiplier Margin Turnover
- 25. Using the Du Pont Identity • ROE = PM * TAT * EM – Profit margin is a measure of the firm’s operating efficiency – how well does it control costs – Total asset turnover is a measure of the firm’s asset use efficiency – how well does it manage its assets – Equity multiplier is a measure of the firm’s financial leverage
- 26. Potential Problems • There is no underlying theory, so there is no way to know which ratios are most relevant • Benchmarking is difficult for diversified firms • Globalization and international competition makes comparison more difficult because of differences in accounting regulations • Varying accounting procedures, i.e. FIFO vs. LIFO • Different fiscal years • Extraordinary events
- 27. • Comparison with industry averages is difficult if the firm operates many different divisions. • “Average” performance is not necessarily good. • Seasonal factors can distort ratios. (More…)
- 28. • Window dressing techniques can make statements and ratios look better. • Sometimes it is difficult to tell if a ratio value is “good” or “bad.” • Often, different ratios give different signals, so it is difficult to tell, on balance, whether a company is in a strong or weak financial condition.
- 29. What are some qualitative factors analysts should consider when evaluating a company’s likely future financial performance? • Are the company’s revenues tied to a single customer? • To what extent are the company’s revenues tied to a single product? • To what extent does the company rely on a single supplier? (More…)
- 30. • What percentage of the company’s business is generated overseas? • What is the competitive situation? • What does the future have in store? • What is the company’s legal and regulatory environment?
- 31. Non-Financial Measures of Operating Effectiveness • Innovation • Customer Service • Product Quality • Reputation • Good Employee Relations
- 32. Balanced Scorecard • Organisational Learning and Growth (Employee Training & Education, Innovation, Opportunities for Improvement, New Product Dev. Time) • Business and Production Process Efficiency (Quality, Productivity, Cycle time) • Customer Value (Customer Satisfaction and Loyalty) • Financial Performance
Editor's Notes
- Value of any financial asset is the PV of future cash flows Bonds: PV of promised interest & principal payments Stocks: PV of all future dividends Patents, trademarks: PV of future royalties Valuation is the process linking risk & return Output of process is asset’s expected market price A key input is the required [expected] return on an asset Defined as the return an arms-length investor would require for an asset of equivalent risk Debt securities: risk-free rate plus risk premium(s) Required return for stocks found using CAPM or other asset pricing model Beta determines risk premium: higher beta, higher reqd return
- Improving our operating efficiency or our asset use efficiency will improve our return on equity. If the TAT is low compared to our benchmark, then we can break it down into more detail by looking at inventory turnover and receivables turnover. If those areas are strong then we can look at fixed asset turnover and cash management. We can also improve our ROE by increasing our leverage – up to a point. Debt affects a lot of other factors, including profit margin, so we have to be a little careful here. We want to make sure we have enough debt to utilize our interest tax credit effectively, but we don’t want to overdo it. The choice of leverage is discussed in more detail in chapter 13.